
Jenkins Grafana data source
The Jenkins data source plugin allows you to query and visualize metrics such as projects, builds, build queues, nodes and load statistics from within Grafana.
Requirements
This plugin has the following requirements:
- A Jenkins instance with Remote Access API enabled.
- One of the following account types:
- Available for users with a Grafana Cloud Free, Advanced or Trial account or with an activated Grafana Enterprise license.
Install the plugin
To install the data source, refer to Installation.
Configure the data source in Grafana
Add a data source by filling in the following fields:
Basic fields
To read more on the Jenkins Remote Access API, visit the documentation
Configure the data source with provisioning
It is possible to configure data sources using configuration files with Grafana’s provisioning system. To read about how it works, including all the settings that you can set for this data source, refer to Provisioning Grafana data sources
Here are some provisioning examples for this data source:
apiVersion: 1
datasources:
  - name: Jenkins
    type: grafana-jenkins-datasource
    jsonData:
      url: https://ci.jenkins.io
      username: <username>
    secureJsonData:
      password: <password>
Import a dashboard for Jenkins
Follow these instructions for importing a dashboard.
You can find imported dashboards in Configuration > Data Sources > select your Jenkins data source > select the Dashboards tab to see available pre-made dashboards.
There are two pre-made dashboards available:
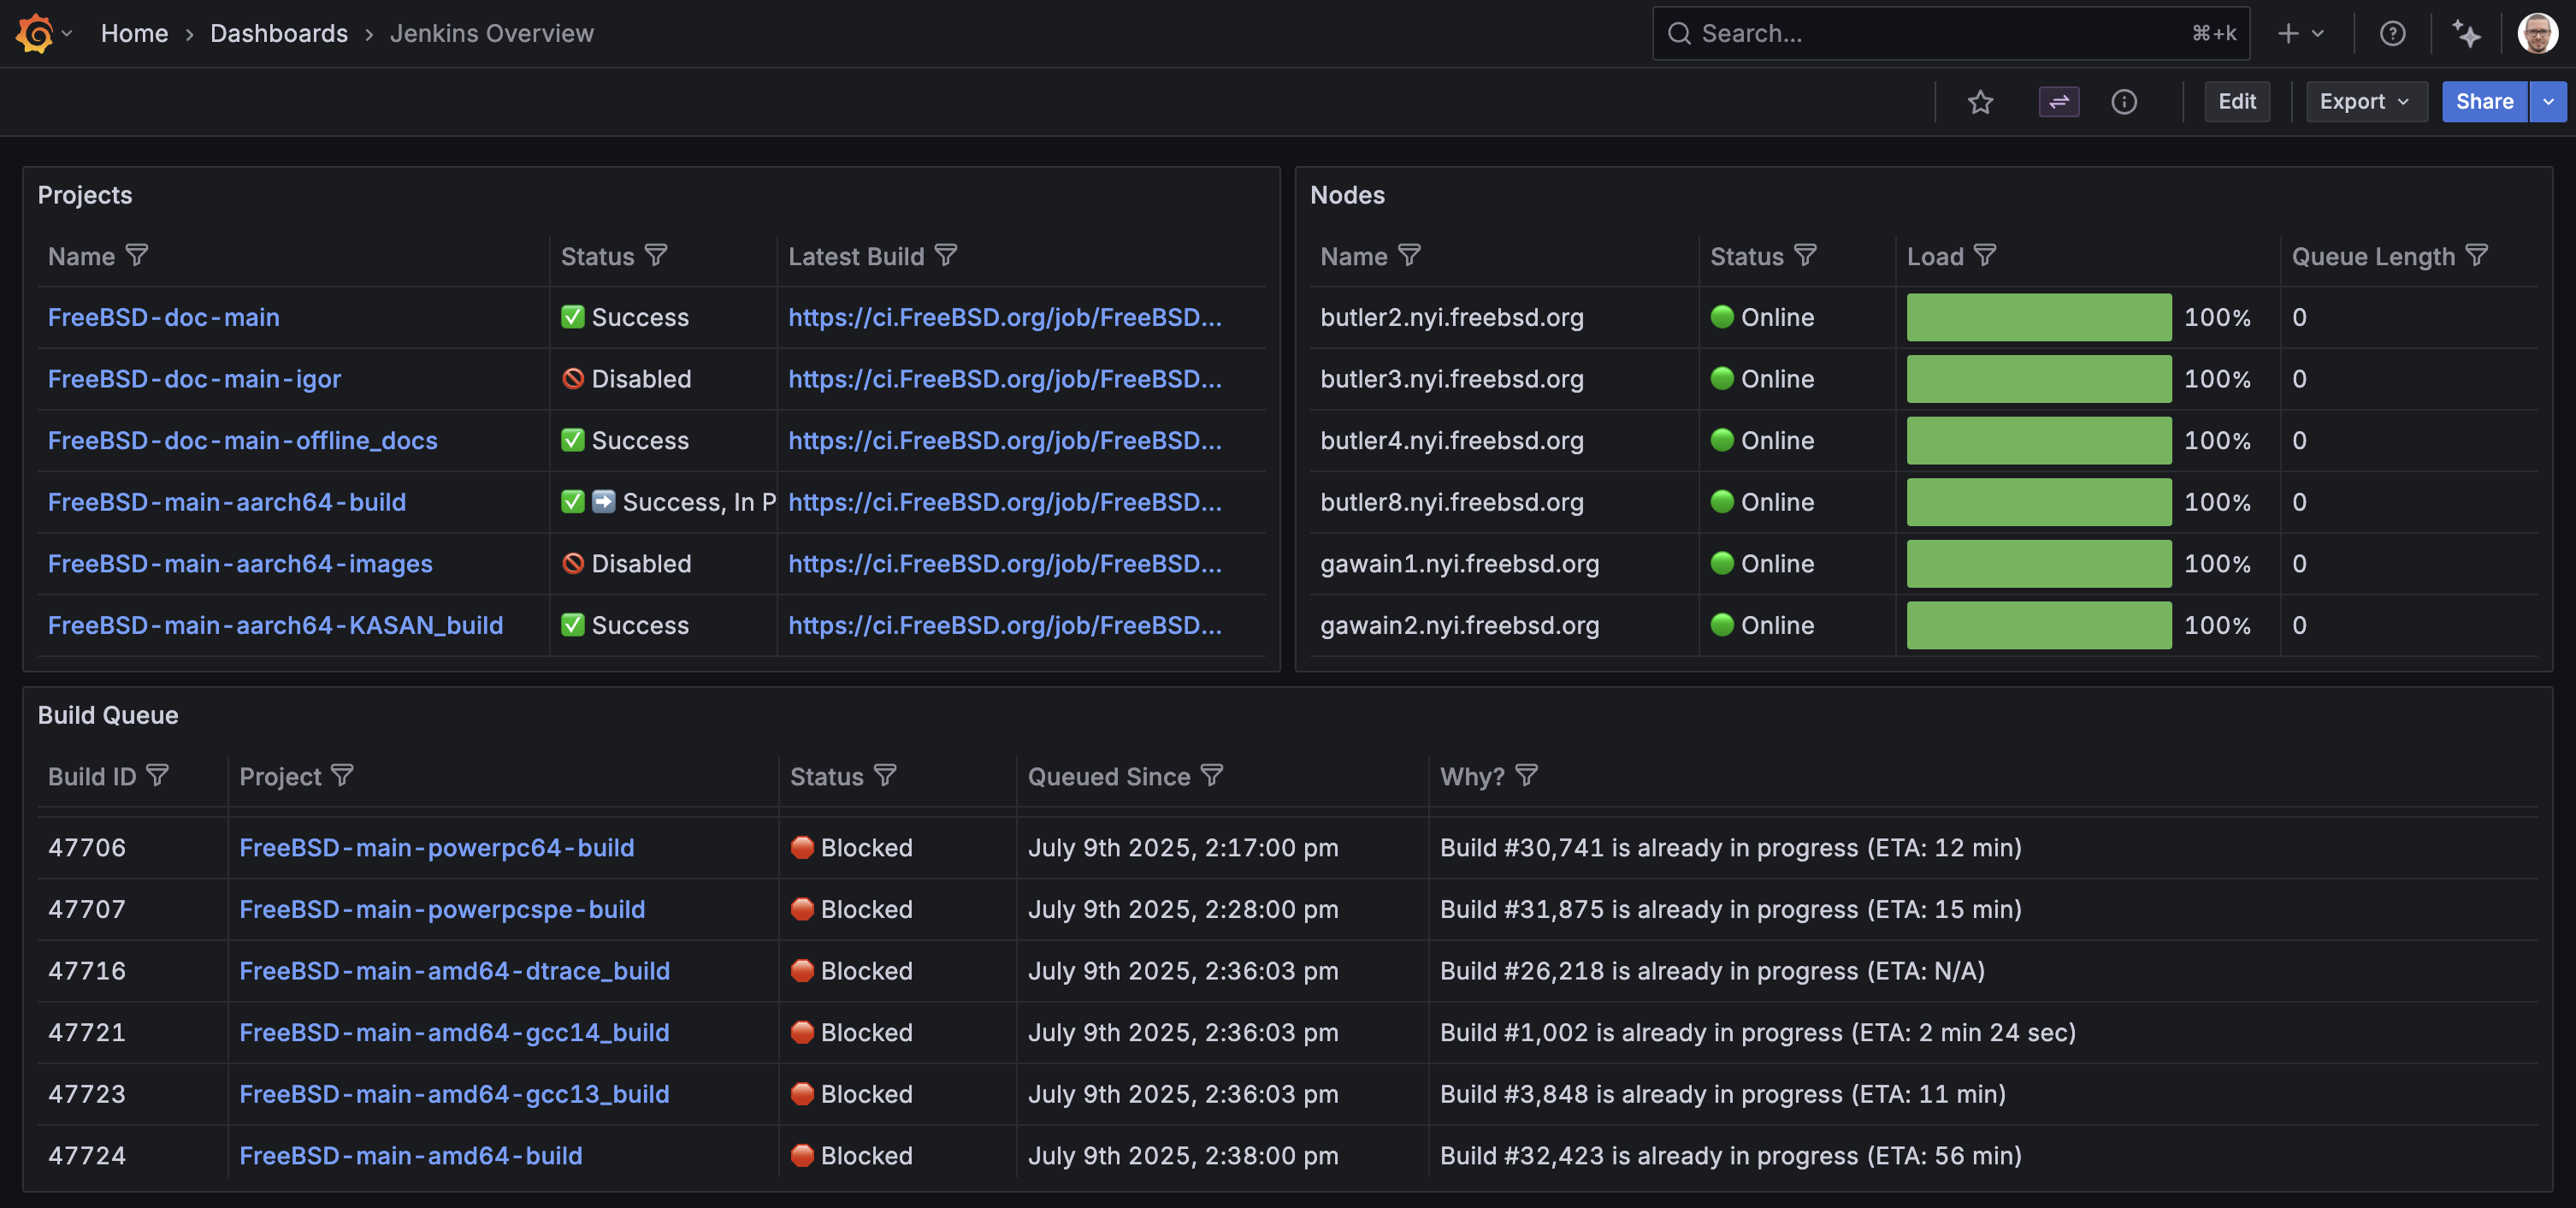
Jenkins Overview - provides an overview of the Jenkins instance, including all projects, nodes, executor status and build queue.
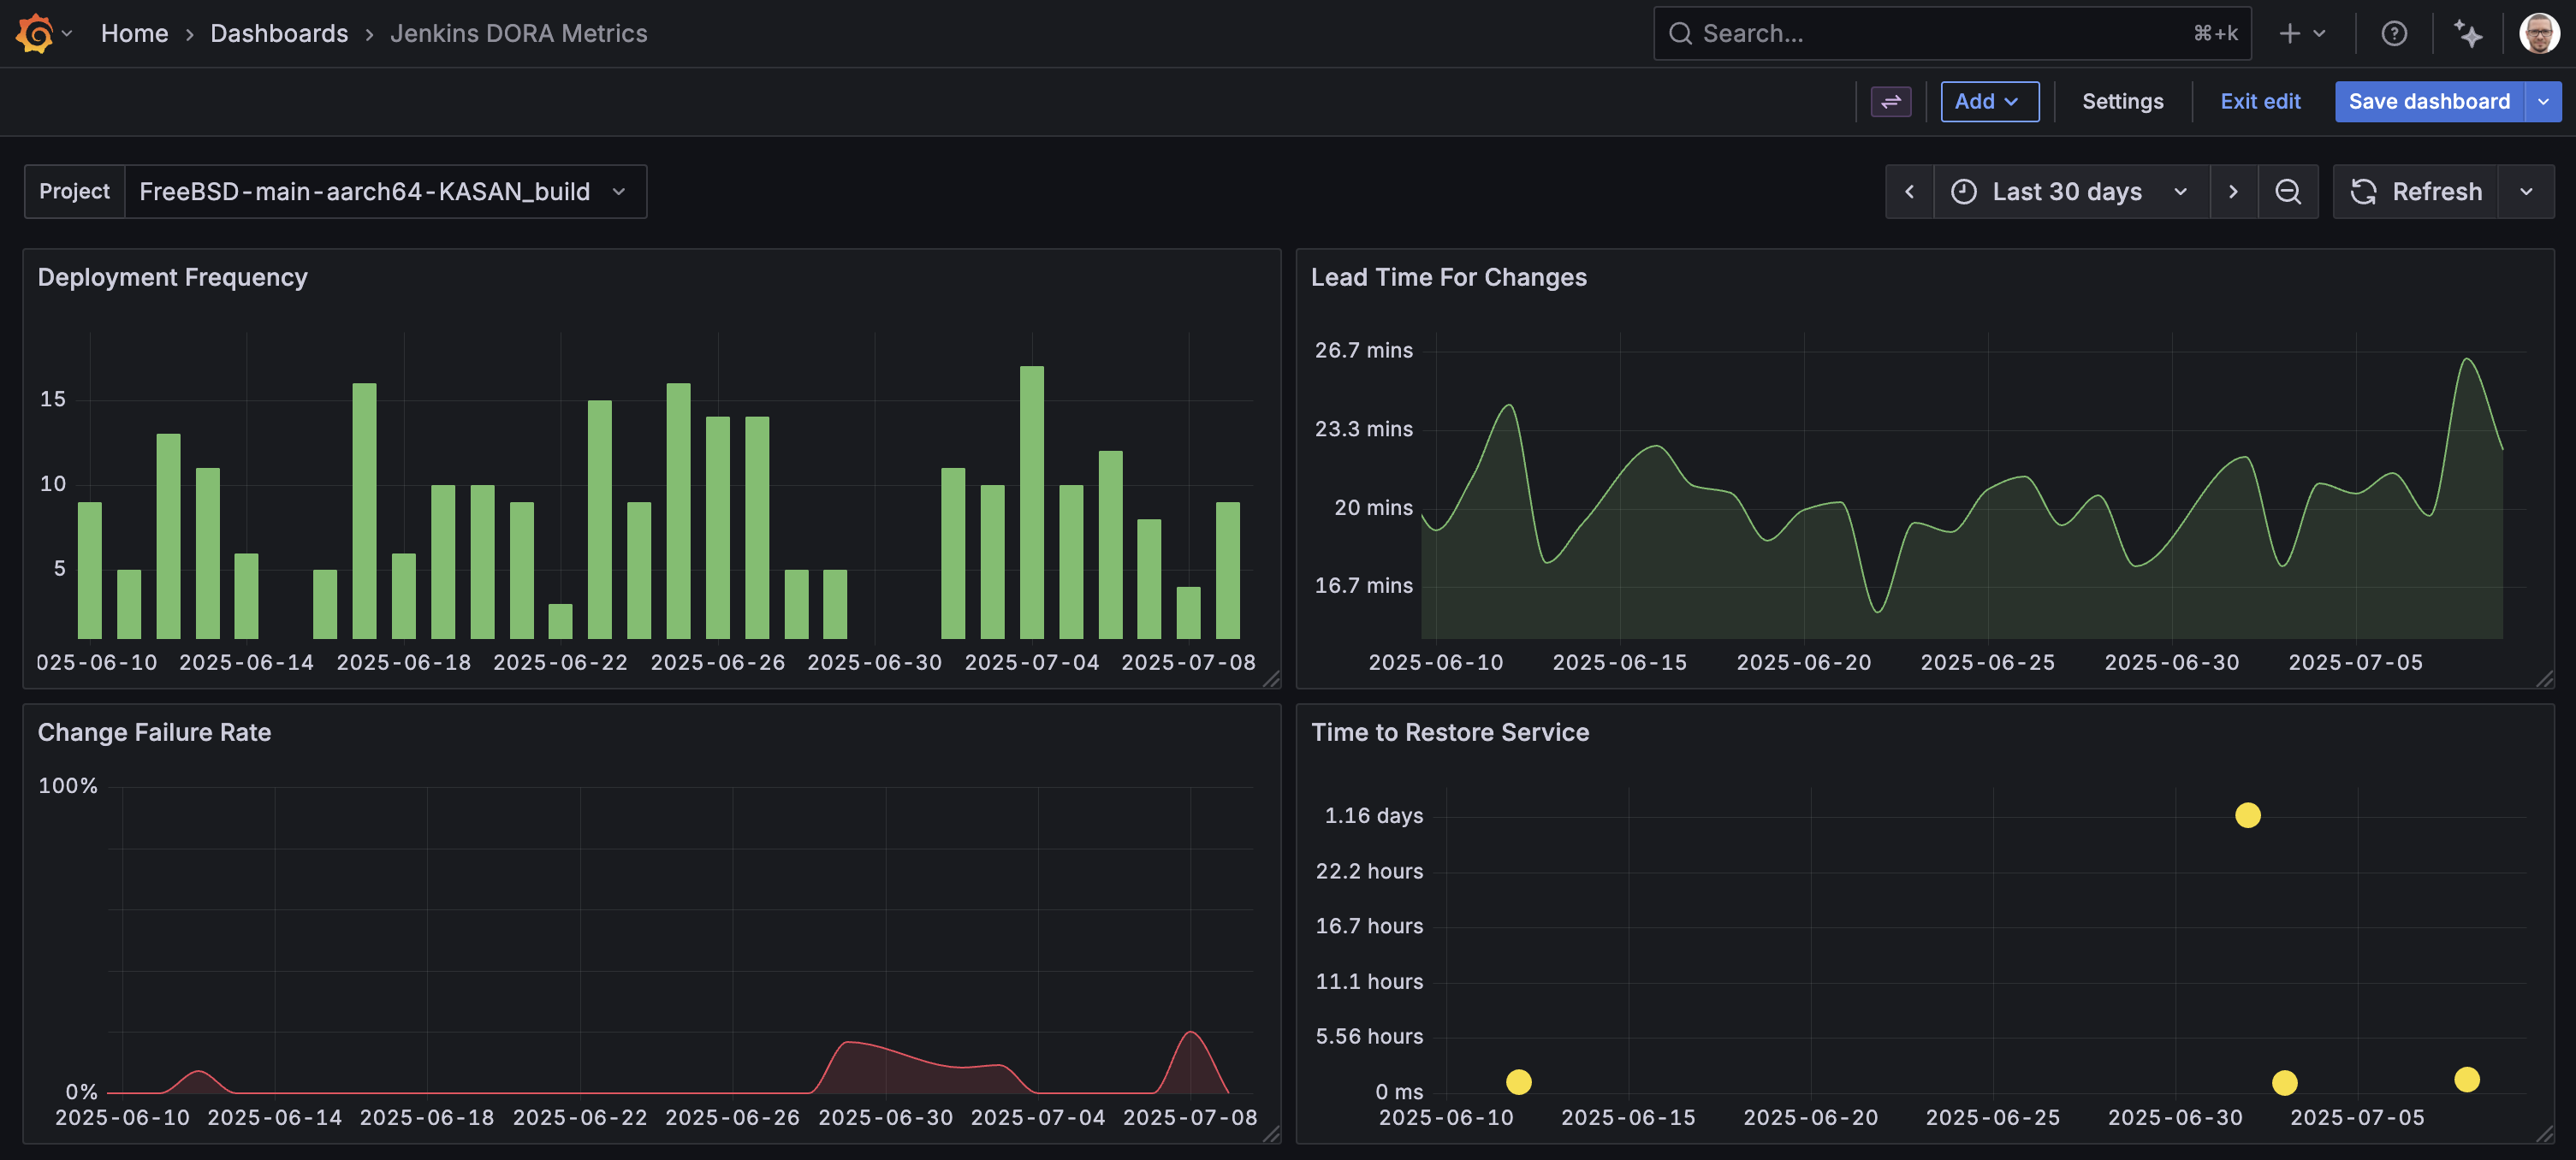
Jenkins DORA Metrics - provides information on four key metrics used to assess software development team performance: deployment frequency, lead time for changes, change failure rate and time to restore service. These metrics focus on both the speed and stability of software delivery.
Learn more
- Add Annotations.
- Configure and use Templates and variables.
- Add Transformations.
Was this page helpful?
Related resources from Grafana Labs


