
What's new from Grafana Labs
Grafana Labs products, projects, and features can go through multiple release stages before becoming generally available. These stages in the release life cycle can present varying degrees of stability and support. For more information, refer to release life cycle for Grafana Labs.
Loading...
Area of interest:
Cloud availability:
Cloud editions:
Self-managed availability:
Self-managed editions:
No results found. Please adjust your filters or search criteria.
There was an error with your request.
We are excited to announce SCIM user and group provisioning.
Previously, provisioned users needed to individually sign in to Grafana to exist within the platform, and administrators faced the time-consuming task of creating and managing teams - either manually or via provisioning. This process was complicated and often presented a bottleneck for new team members getting up and running quickly.
With this release we’re rethinking our dashboards APIs and introducing a new model that is consistent, versioned, and resource-oriented. We’re releasing them as experimental, with the intent to gather feedback and deliver a stable version to users with one of the next releases.
We’re excited to announce that the Grafana Cloud Migration Assistant is now generally available to all users! After a successful public preview period, this powerful tool is ready to transform how self-managed Enterprise customers and OSS users transition to Grafana Cloud.
This brand new feature, coming to Public Preview in Grafana v12, is designed to streamline how you approach problem-solving by bringing all your relevant signals together in one unified view.
Last October at ObsCon, we announced the GA of Logs Drilldown, and we’ve been hard at work expanding its capabilities to help you visualize your logs data with more flexibility and options.
At ObsCon last October, we announced the GA of Metrics Drilldown, and we’ve been hard at work expanding its capabilities to help you reduce the number of metrics you need to manage with just a few clicks.
Effective starting in Grafana 12.0, the configuration option editors_can_admin is removed.
The editors_can_admin setting in Grafana allows users with the Editor role to create and manage Grafana Teams. Editors in instances with this configuration setting no longer have these extra privileges.
Troubleshooting with traces just got a lot faster in Grafana Cloud. Trace correlations lets you configure custom, context-aware links straight into every span in the trace view. With a single click, you can now jump from a trace to:
We are excited to announce the public preview of native histograms!
Native histograms are a metric type in Prometheus that can produce, store, and query high-resolution histograms of observations. They usually offer higher resolution and more straightforward instrumentation than classic histograms.
We’re excited to announce that k6 browser checks in Synthetic Monitoring are now generally available.
k6 browser checks allow you to go beyond traditional monitoring, enabling you to test and validate real user flows and gain insight into performance in ways you can’t with HTTP-level checks. With browser checks, you’re not just monitoring performance at a protocol level; you’re simulating user interactions that provide you with a much richer view of your app’s behavior in production.
You can define custom labels at the scrape job level across all services in a job, making it easier to:
- Attribute costs
- Track ownership
- Apply consistent metadata
Especially valuable for teams without direct access to AWS tagging, this feature:
You can now configure logs queries per-service and override the global configuration for services in Application Observability.
This feature allows you to change how service details query logs and facilitate traces to logs, providing the flexibility to mix and match signals across databases and datasources.
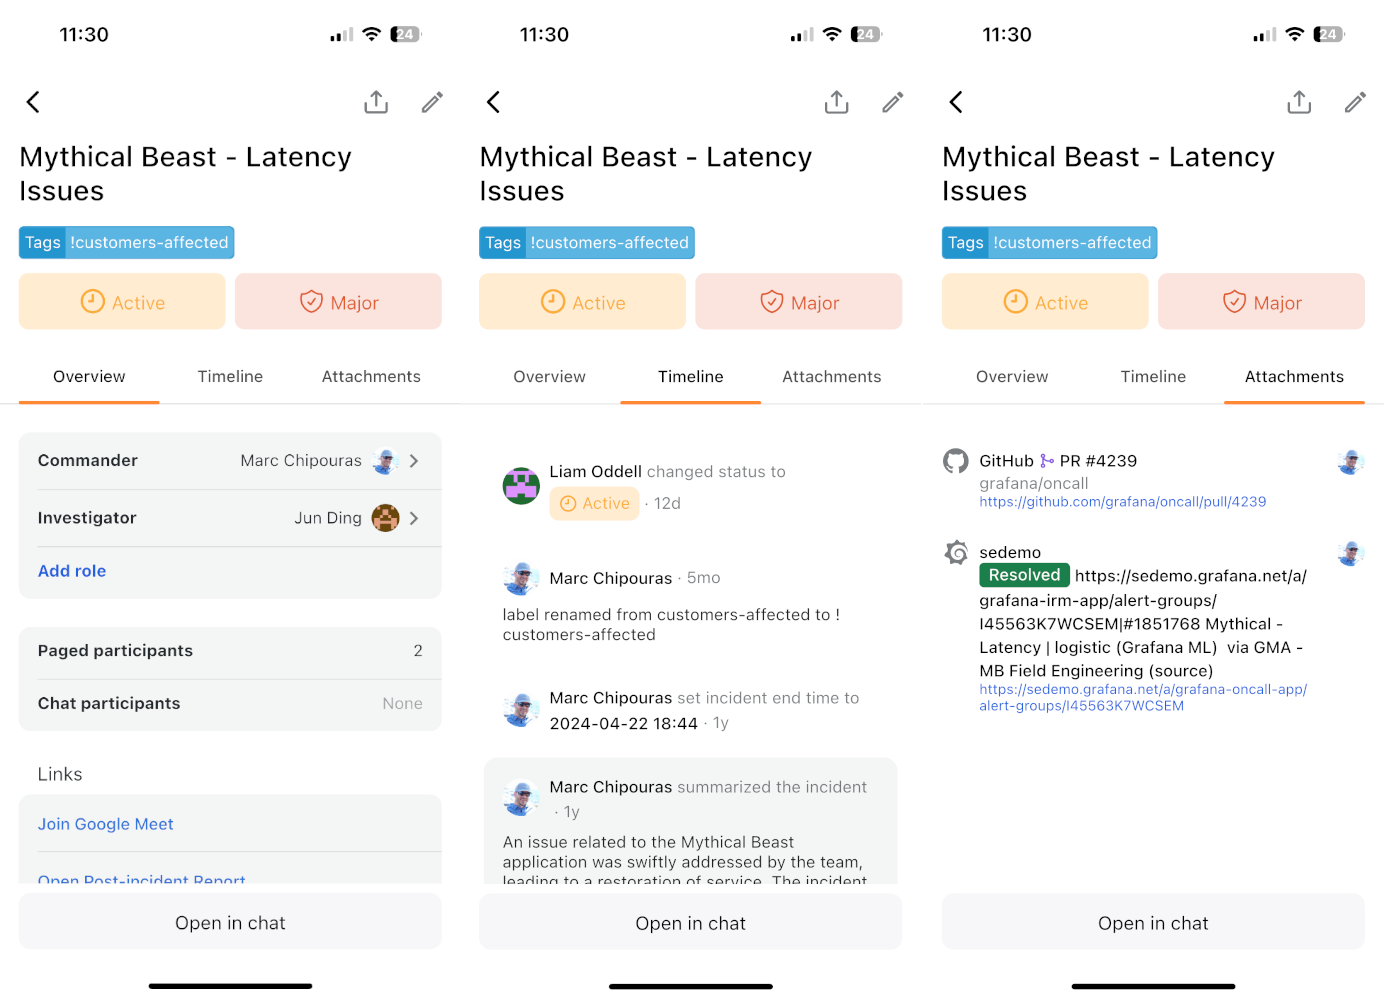
We keep making it easier to manage incidents from anywhere — no laptop needed!
With this latest update, you can now dive into the full incident timeline directly from your phone. Instantly catch up on everything that’s happened: comments, notes, attachments, and key activity — all organised chronologically.
We are excited to announce the General Availability (GA) release of Grafana Traces Drilldown, bringing a simplified, queryless experience to distributed tracing analysis. Building on months of public preview feedback and lessons learned from the Drilldown suite, this GA release delivers a refined, integrated solution for deep-dive trace analysis.
Pipelines in Grafana Fleet Management can now inject variable collector attribute values into their configurations. This powerful new feature enables you to create dynamic configurations that adapt to each collector’s characteristics, reducing the need for multiple similar pipelines.