What's new from Grafana Labs
Grafana Labs products, projects, and features can go through multiple release stages before becoming generally available. These stages in the release life cycle can present varying degrees of stability and support. For more information, refer to release life cycle for Grafana Labs.
Loading...
Area of interest:
Cloud availability:
Cloud editions:
Self-managed availability:
Self-managed editions:
No results found. Please adjust your filters or search criteria.
There was an error with your request.
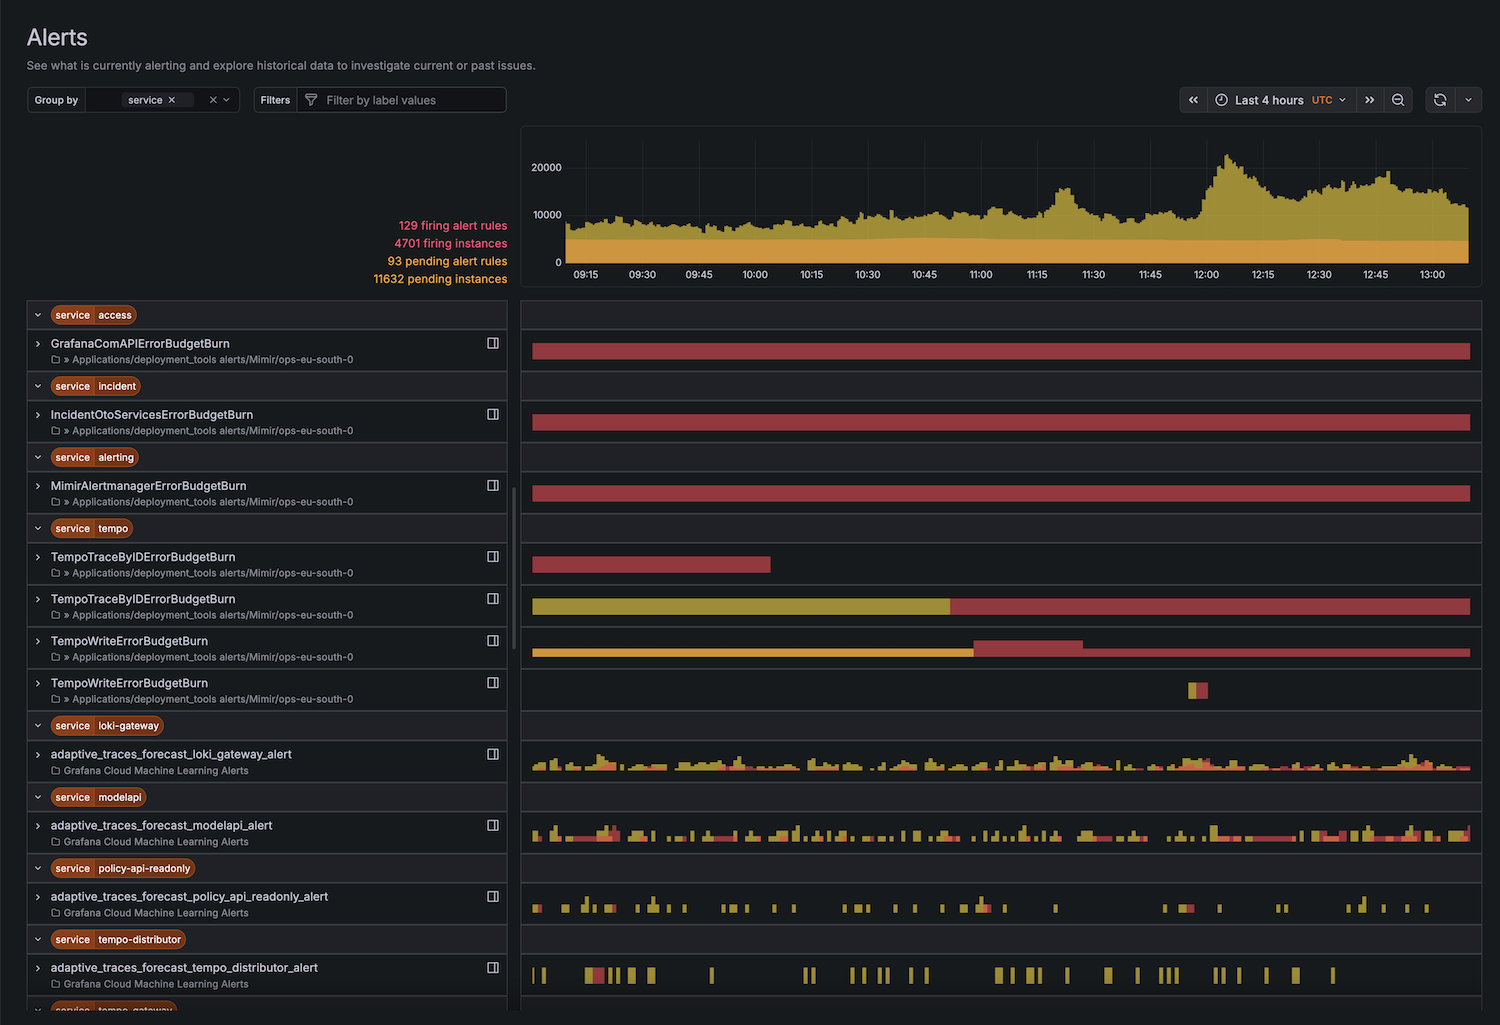
When monitoring complex systems, quickly identifying and prioritizing critical incidents among a large volume of firing or pending alerts can often slow down incident response.
You can now add labels to alert groups in Grafana IRM, giving teams more flexibility to organize, filter, and take action on alerts as they evolve.
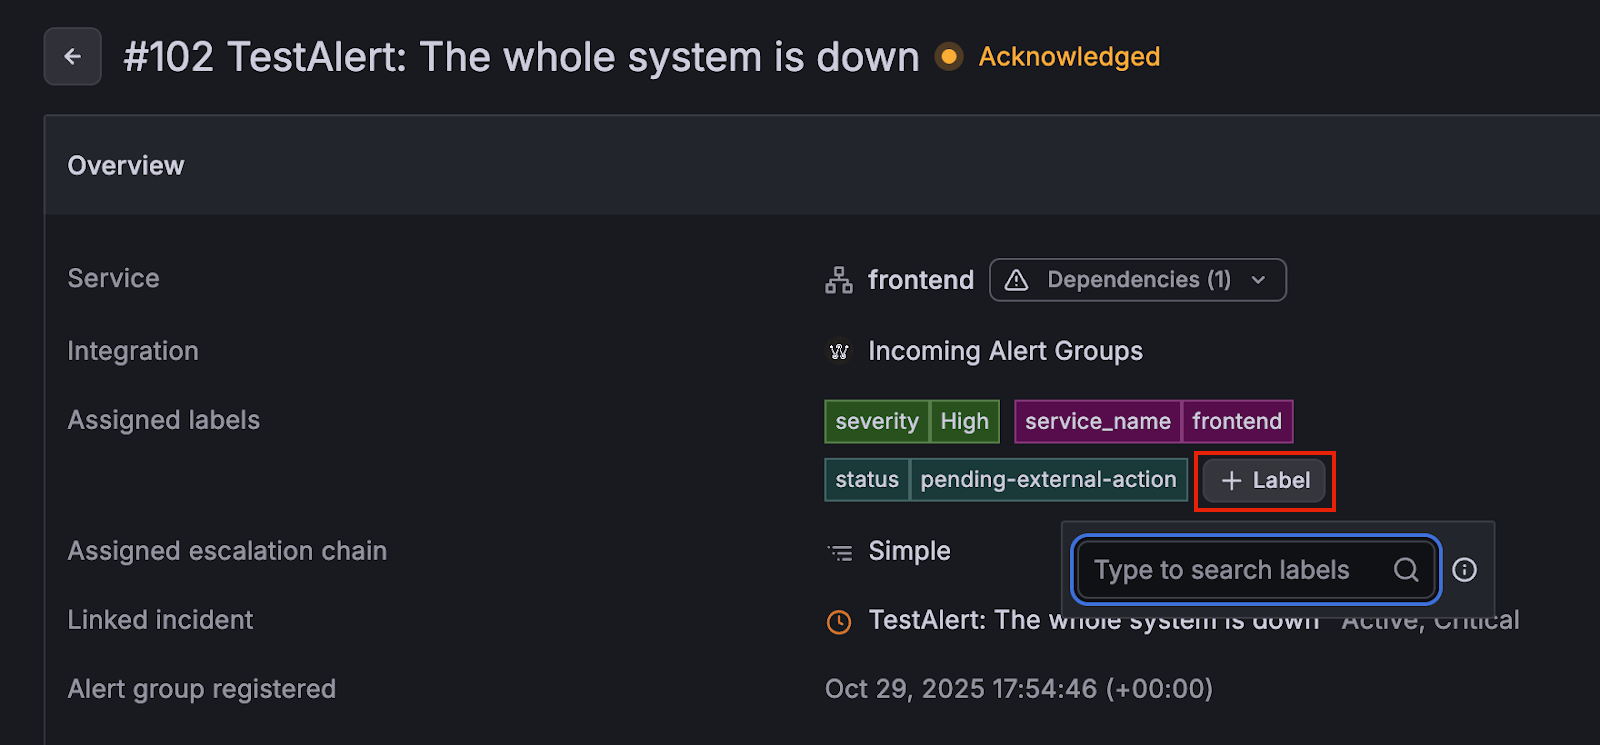
With the new + Label functionality, you can enrich an alert group with additional context at any point via the UI or API. This makes it easier to:
- Add triage context (for example:
triage:needs-follow-up, orstatus:investigating) - Support workflows that depend on labels
- Improve discoverability when many teams share the same IRM instance
- Standardize metadata across alerts coming from diverse systems
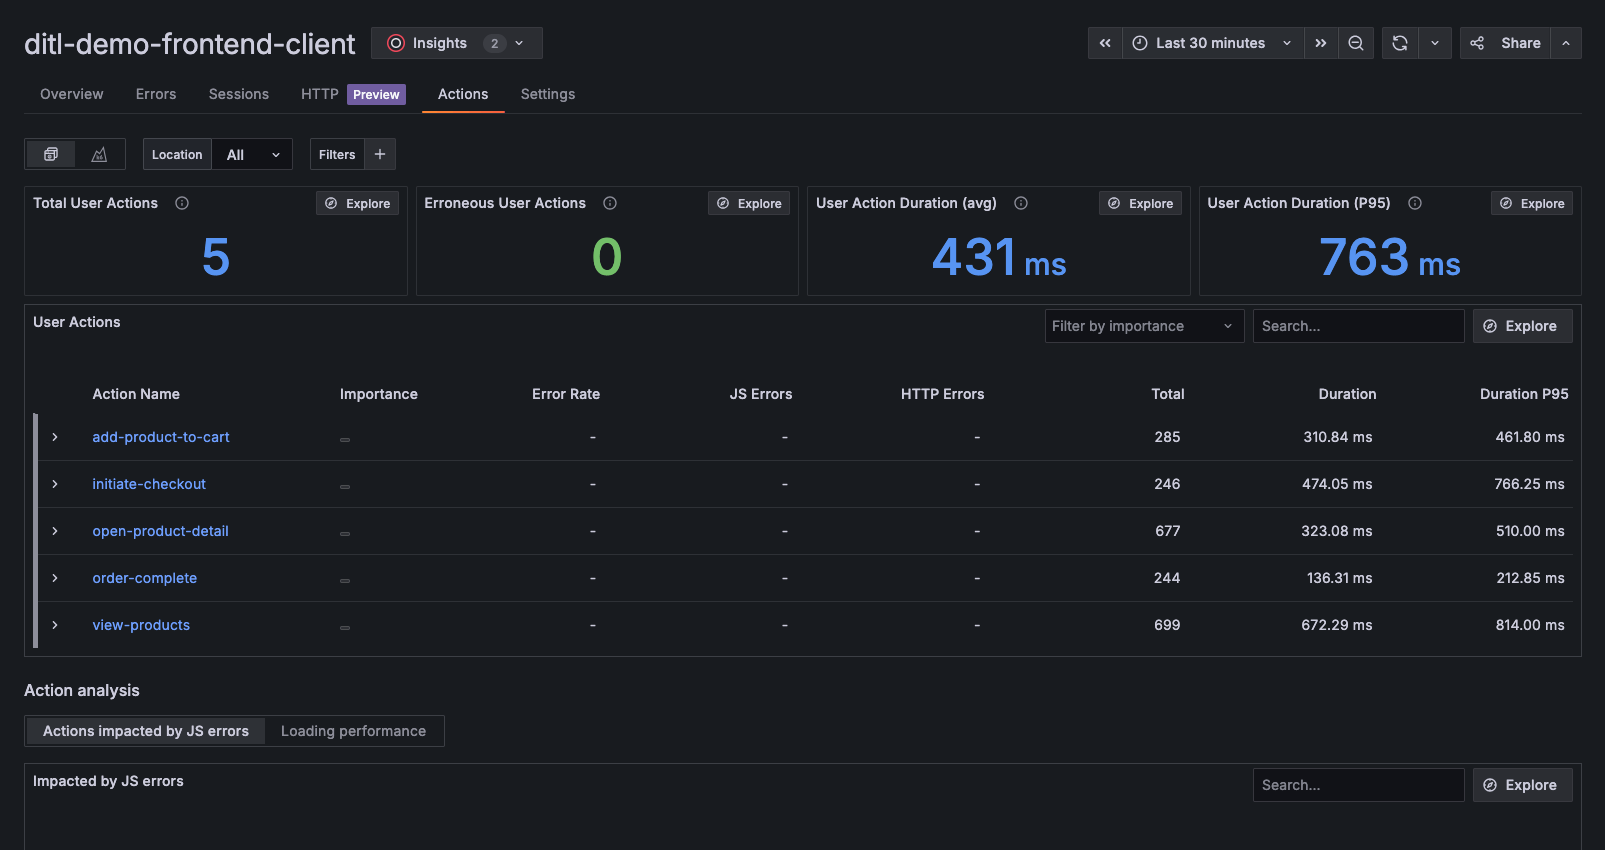
This major release brings new updates to User Actions for GA, introduces improvements to Web Vitals, simplifies configuration, cleans up deprecated internals, and adds experimental navigation instrumentation for soft navigations.
User Actions is a new capability in Grafana Frontend Observability that helps you track, analyze, and troubleshoot the most important interactions users perform in your web applications.
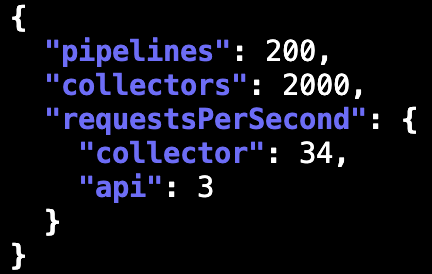
Fleet Management has a new API designed to help you understand the collector, configuration pipeline, and API rate limits that apply to your stack.
A request to the GetLimits endpoint returns the limits you need to know to keep your fleet running smoothly.
Grafana Fleet Management now supports private connections to all three major cloud providers. In addition to AWS PrivateLink, we have added support for Azure PrivateLink and Google Cloud Platform (GCP) Private Service Connect. Now you can securely connect to Fleet Management APIs without using the public internet, no matter where your services are hosted.
Create dashboards based on templates using sample data. Then connect your own data to power them with real metrics.
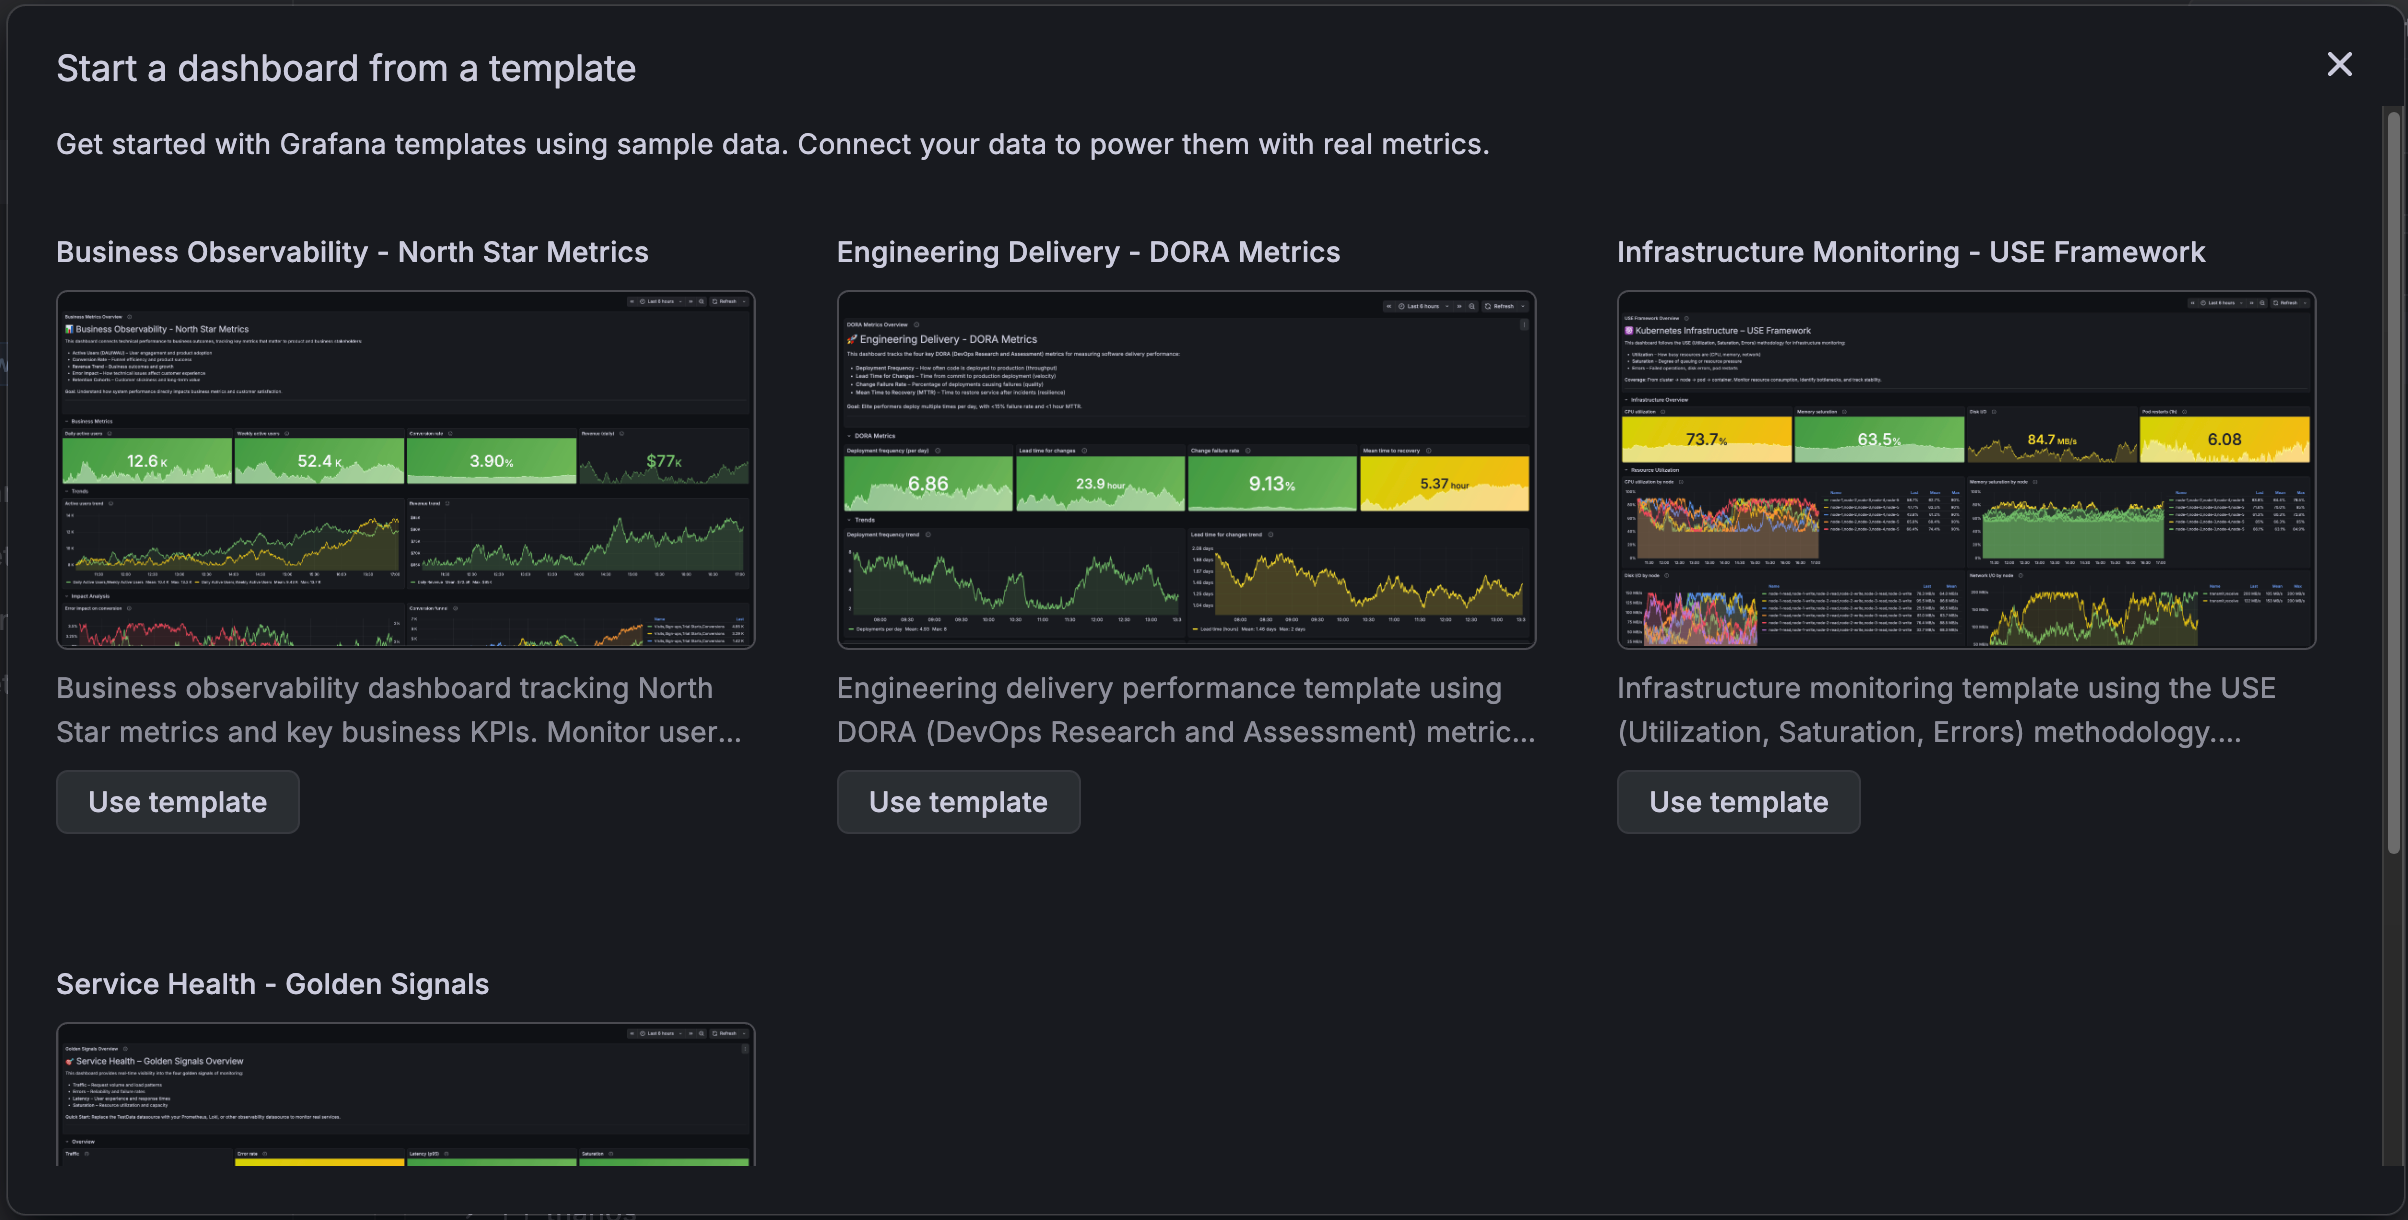
The templates provide standardized dashboard layouts designed to help you answer engineering or business questions consistently. For instance, the DORA template allows all teams within an organization to measure delivery performance using a widely adopted industry framework.
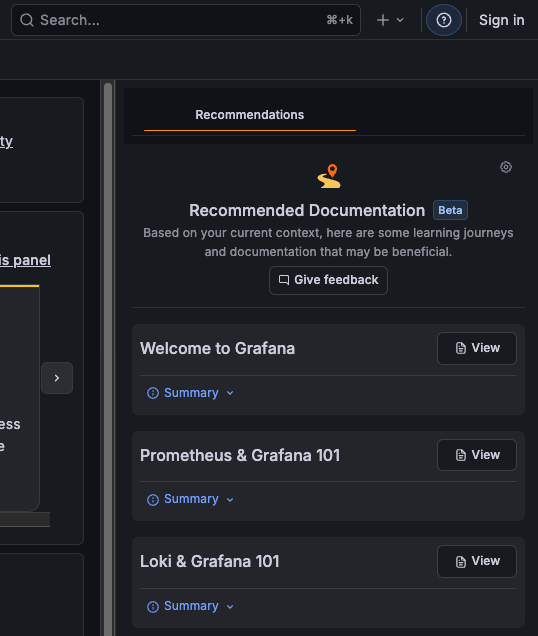
Introducing interactive learning in Grafana
Finding the right documentation at the right time can be tricky, especially when you’re in the middle of working in Grafana. The new interactive learning experience, available in public preview in Grafana 12.3, brings help directly into the product, so you don’t have to leave your workflow to find answers.
Ever created a token that expired too soon, or forgot to set an expiry altogether? You can now update the expiration time of Cloud Access Policy tokens using the Grafana Cloud API.
Many customers give users no basic role as their default starting point. However, until now, there wasn’t a way to selectively grant access to Kubernetes Monitoring. That meant teams who needed Kubernetes capabilities often couldn’t use it without getting far broader permissions than intended.
You can now automatically trigger Assistant investigations from Grafana IRM incidents and alert groups to help your team analyze and resolve issues faster.
This new integration automatically forwards incident or alert data to Grafana Assistant for AI-powered analysis and root-cause investigation. Once triggered, the Assistant coordinates multiple specialist agents to identify potential causes, surface insights, and post updates to the related incident timeline and communication channels.
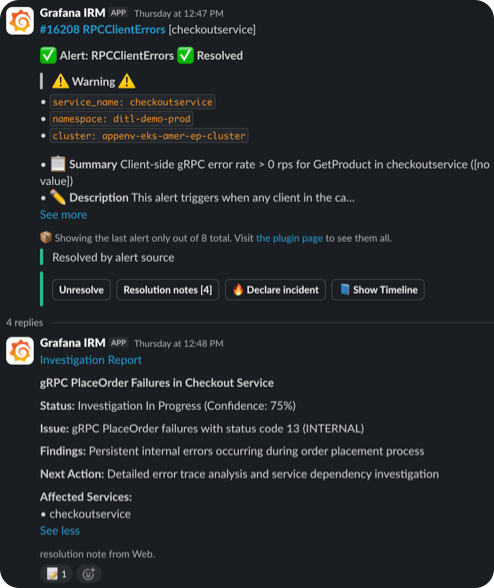
Set up the IRM webhook for Grafana Assistant to start receiving actionable findings and keep your team informed throughout the investigation.
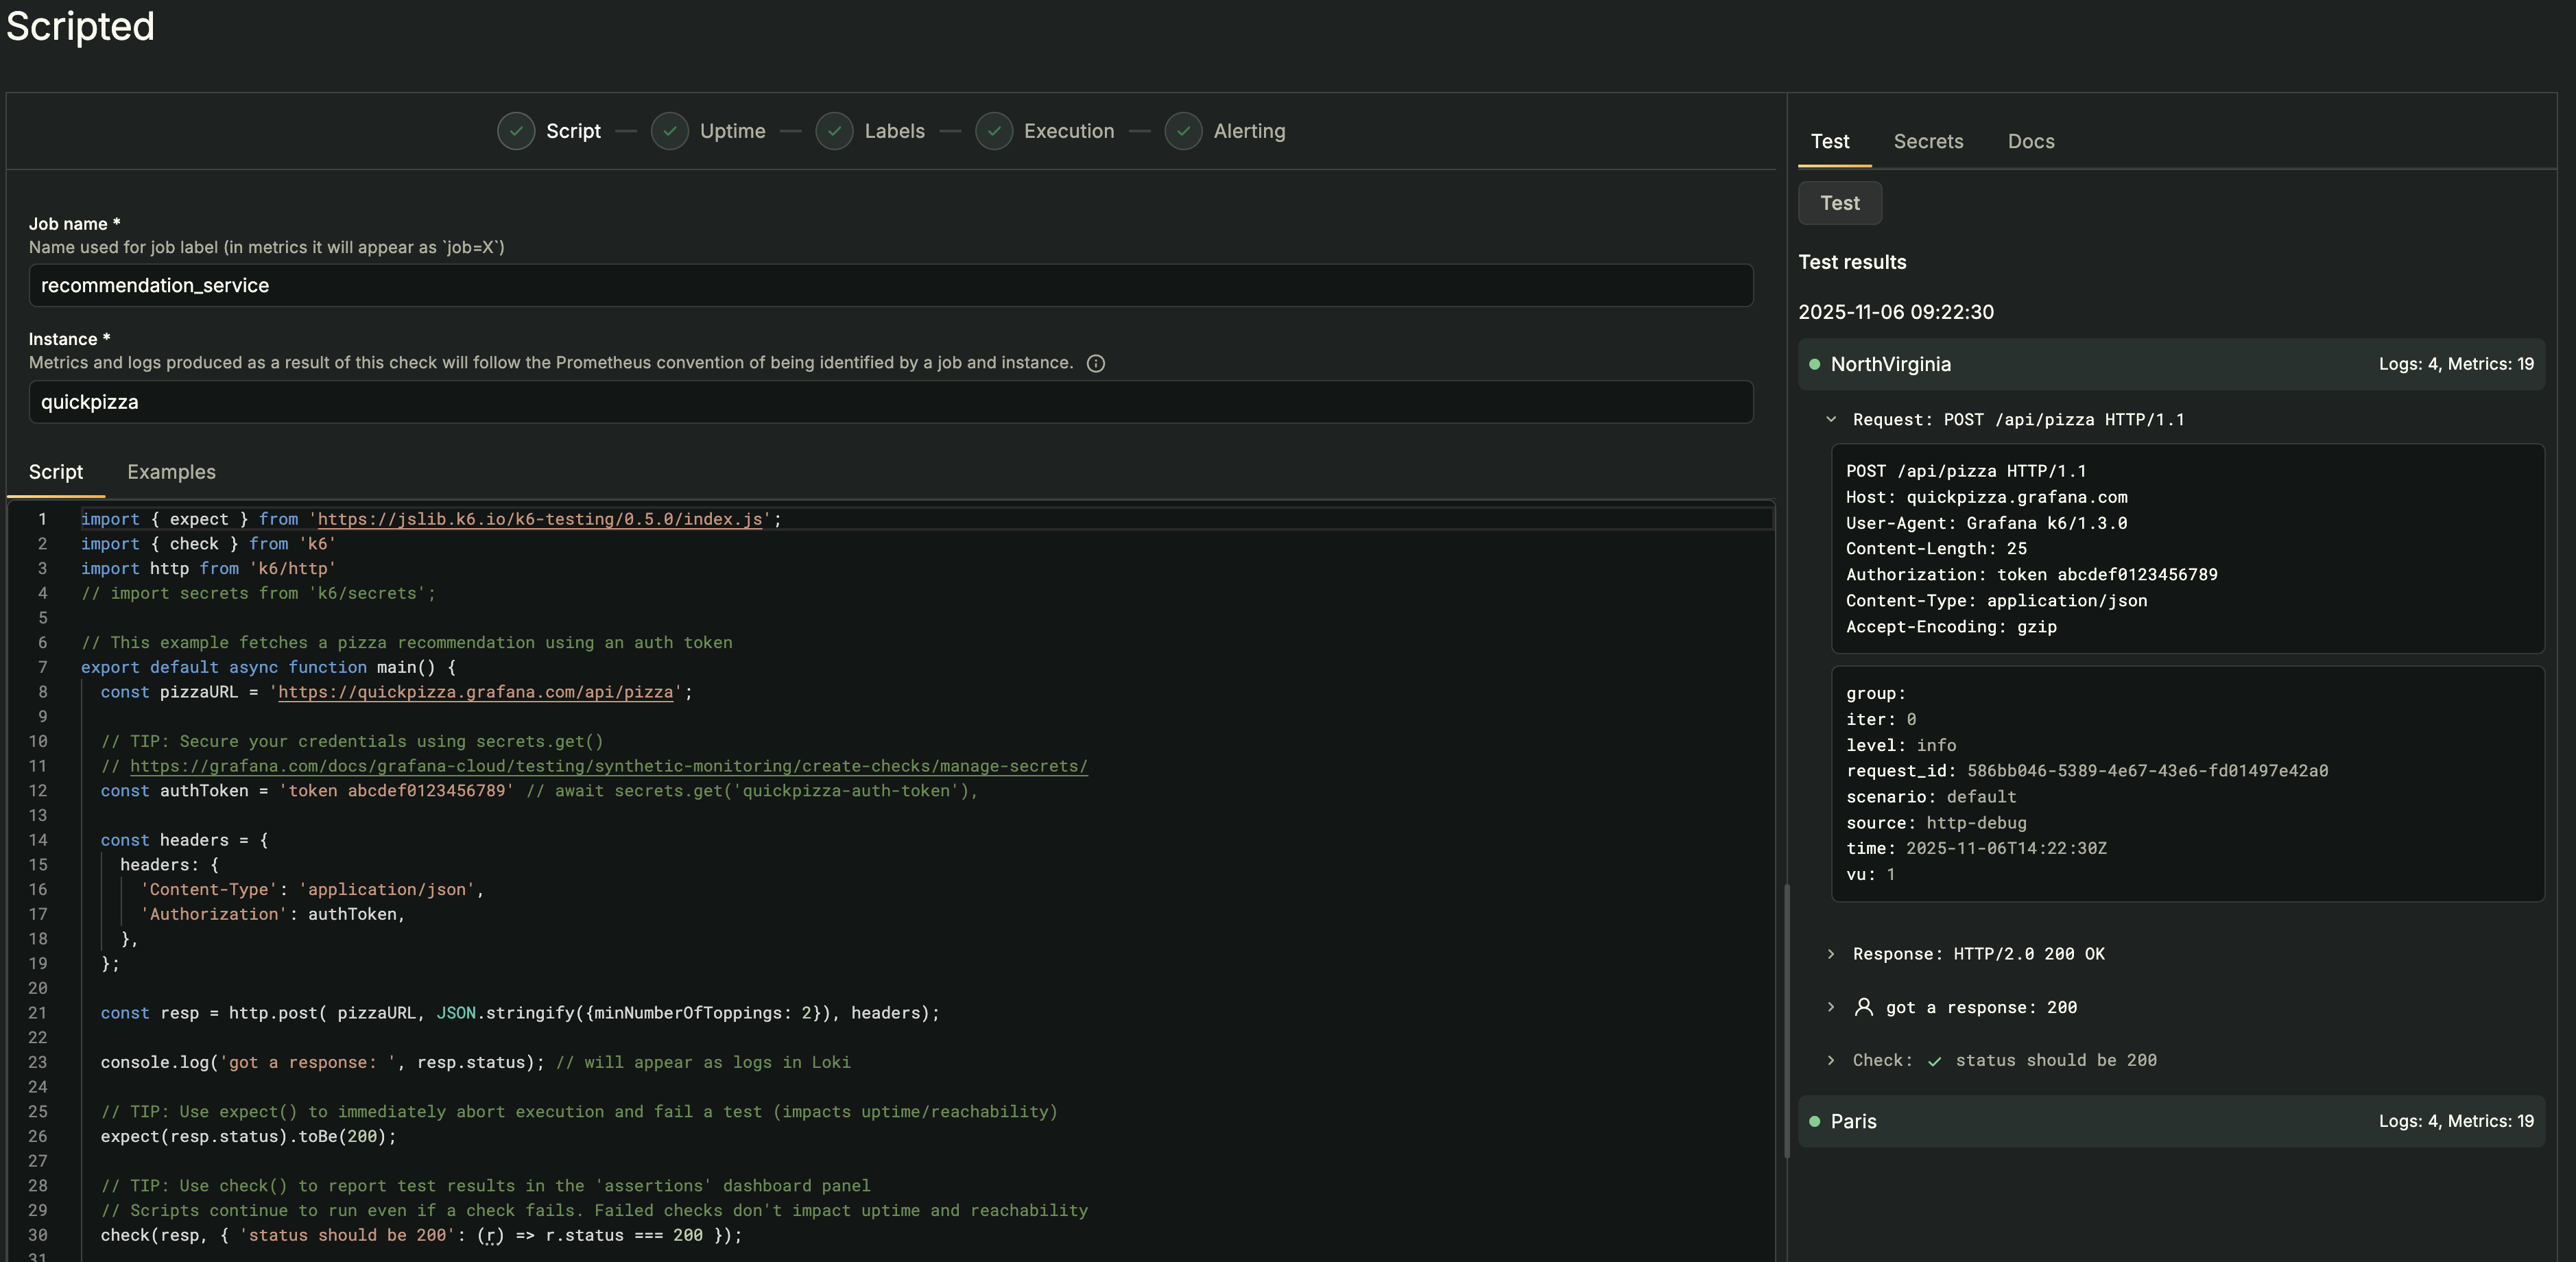
We’ve redesigned the check creation experience in Grafana Cloud Synthetic Monitoring.
This update is mostly a UX change to make check creation in the UI easier. The new UX also lets us plan for future enhancements to this flow.
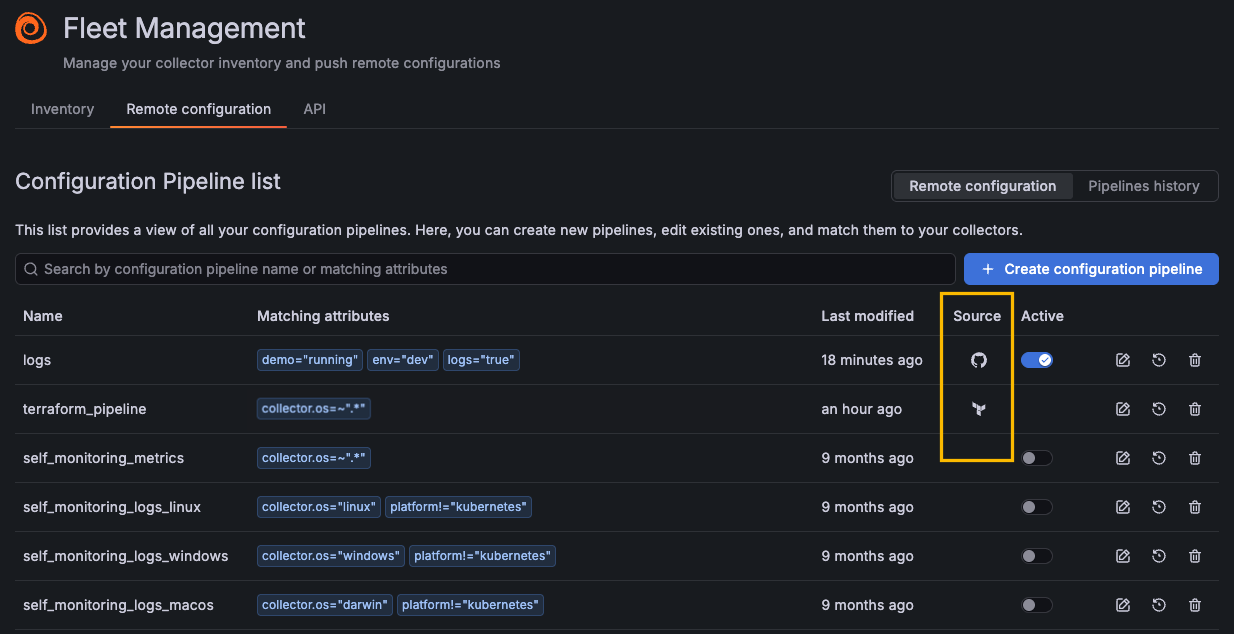
We’ve just made managing your configuration pipelines a whole lot easier! Our brand-new purpose-built GitHub Action lets you automatically sync all of your configuration pipelines across every repository—seamlessly. Once triggered, the Action recursively searches your repos for pipeline definitions and uploads them straight to Grafana Fleet Management using the new SyncPipelines endpoint of the Pipeline API.
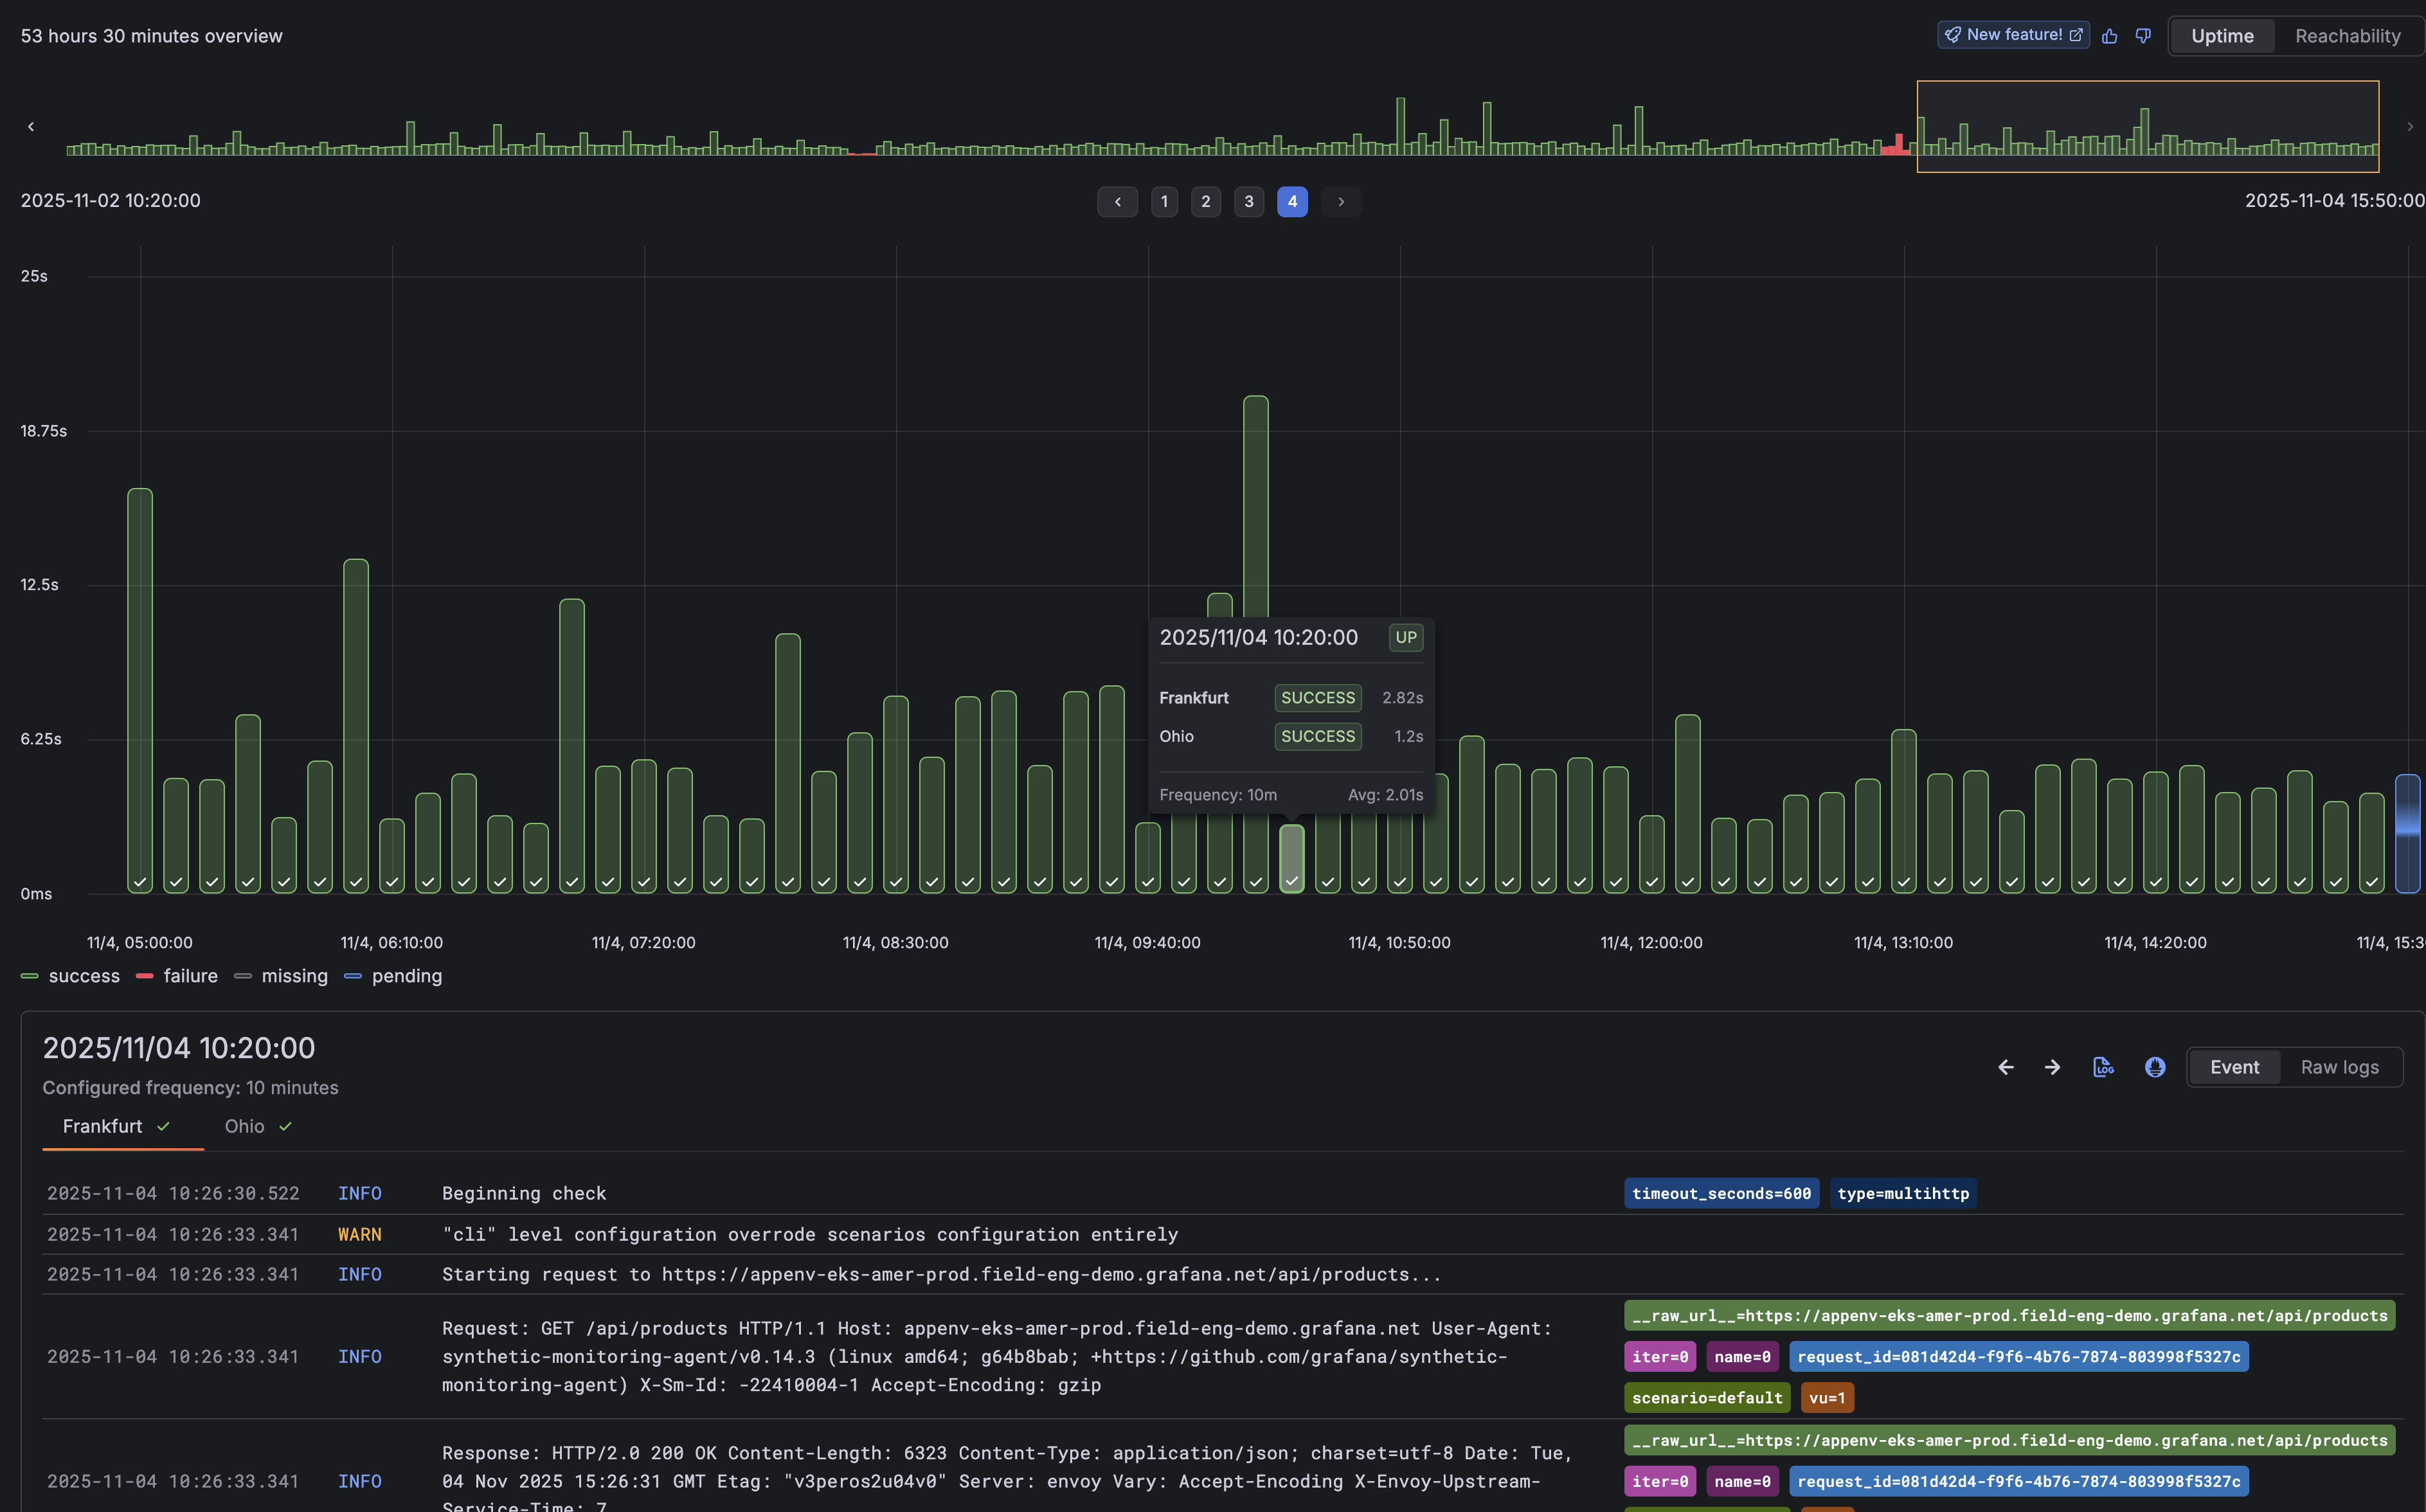
We’ve enhanced the check results page with a new Timepoint Explorer, making it easier to understand exactly when and where issues are occuring.
Timepoint Explorer visualizes every check execution as an individual event, turning results into a timeline you can explore. Each timepoint represents a probe execution, allowing you to pinpoint when failures happened and easily view the logs tied to those executions.
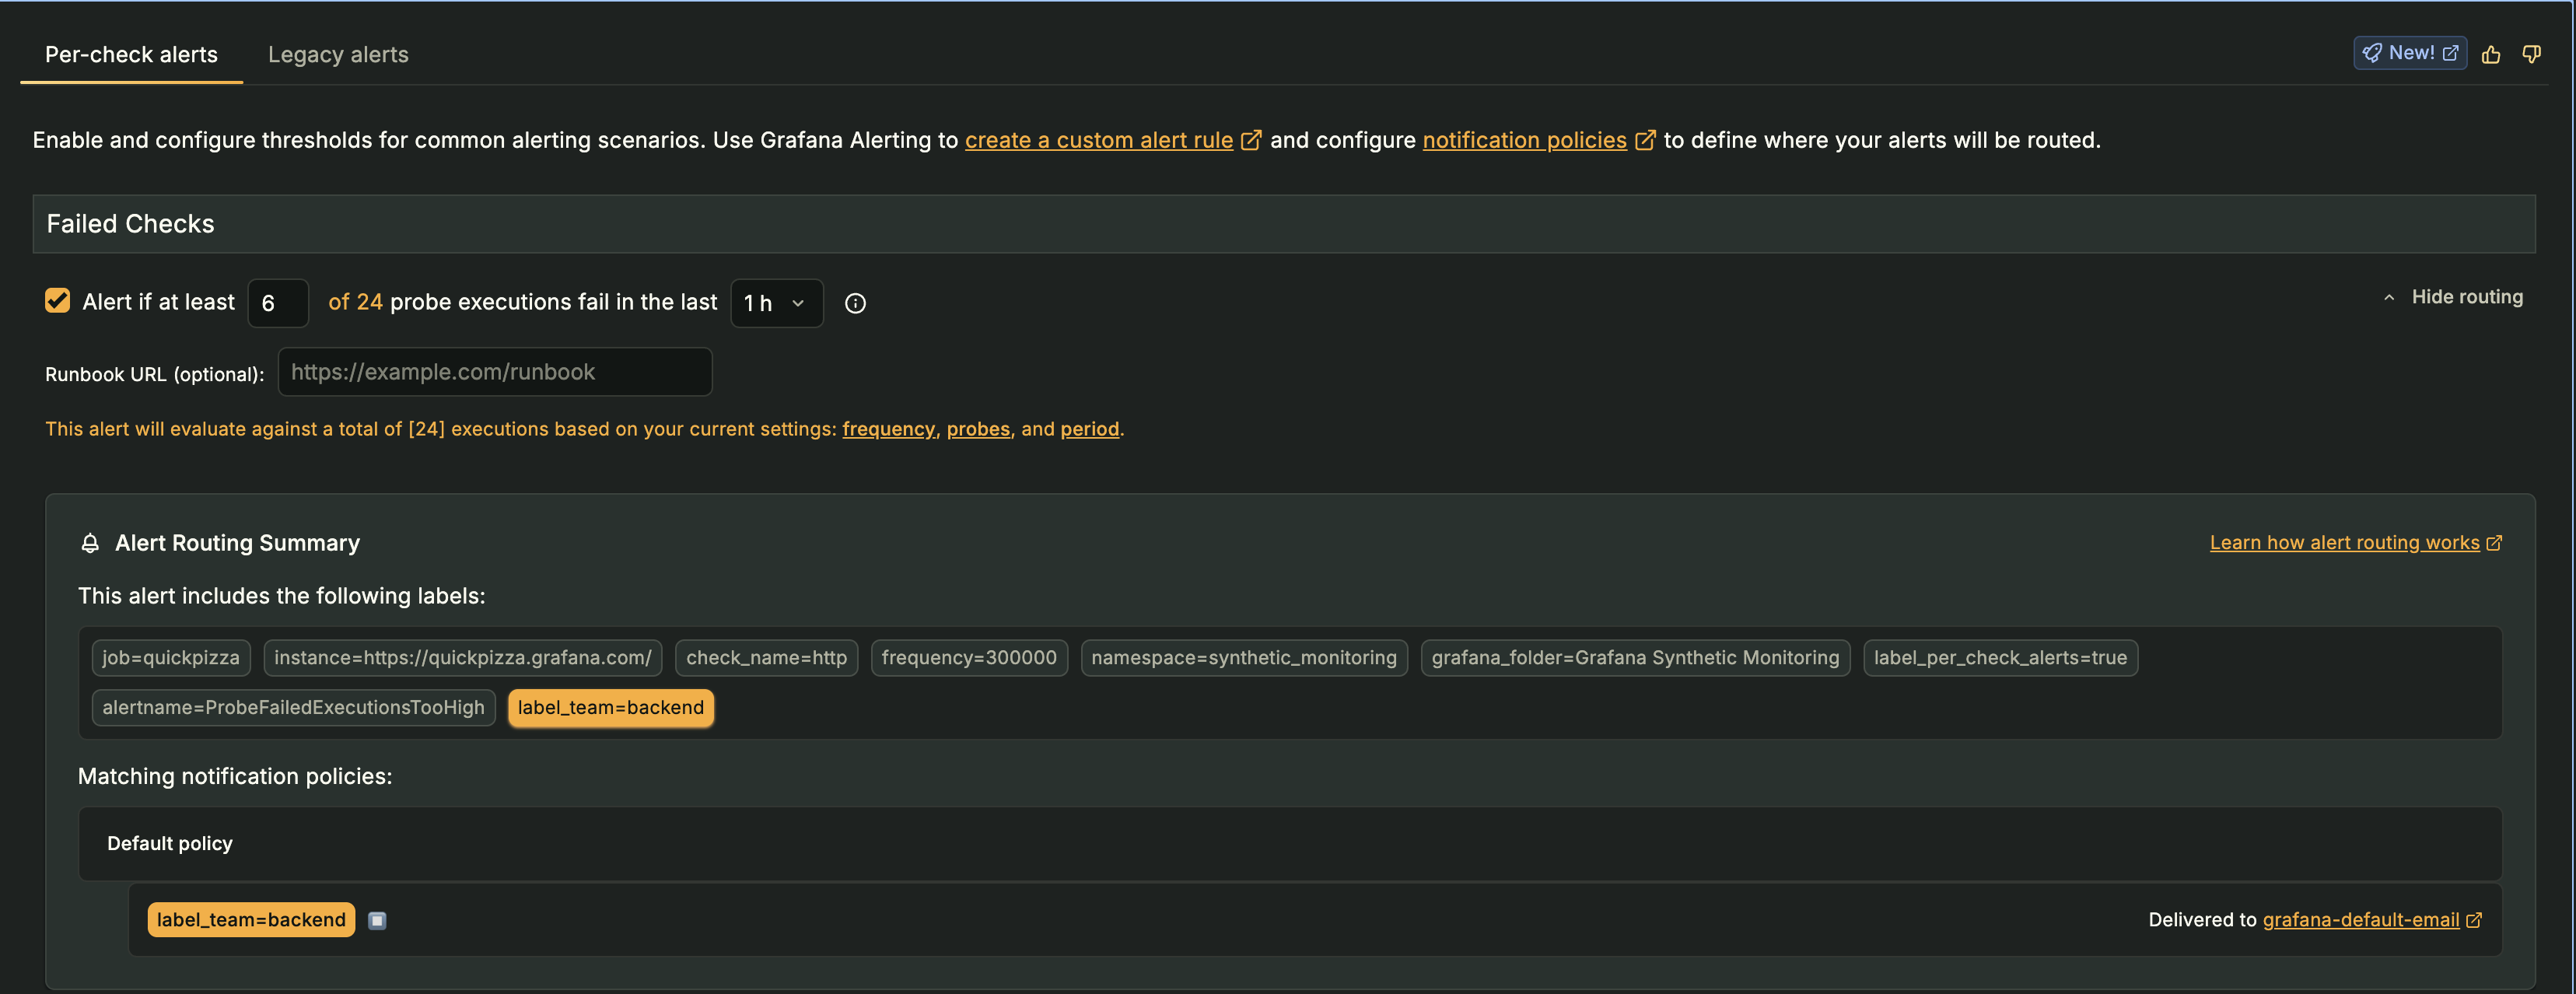
Understanding where your alerts are routed just got a whole lot easier.
When configuring per-check alerts in Grafana Cloud Synthetic Monitoring, you can now see exactly which notification policies your alerts match, right from the UI.