
What's new from Grafana Labs
Grafana Labs products, projects, and features can go through multiple release stages before becoming generally available. These stages in the release life cycle can present varying degrees of stability and support. For more information, refer to release life cycle for Grafana Labs.
Loading...
Area of interest:
Cloud availability:
Cloud editions:
Self-managed availability:
Self-managed editions:
No results found. Please adjust your filters or search criteria.
There was an error with your request.
Instantly pivot from Kubernetes Monitoring to the exact EC2 instance in Cloud Provider Observability that’s impacting performance or stability. Whether it’s a failing node, resource exhaustion, or an unreachable instance, this seamless cross-layer visibility removes manual guesswork and eliminates the need for context-switching.

View GPU utilization panels on the GPU tabs of Cluster and Node detail pages to discover whether Nvidia GPUs inside the Cluster are appropriately utilized and whether workloads are getting and using the GPU resources that have been made available.

Segmentation makes it easy for you to manage Adaptive Logs by team, business unit, or any other logical division.
Using segmentation, you can decentralize log management. Shift responsibility from a central team to smaller units, empowering each to manage their own Adaptive Logs rules and control log intake with confidence.
Grafana Assume Role is now Generally Available (GA) for CloudWatch and Athena data sources! Grafana Assume Role allows you to authenticate with AWS without having to create and maintain long-term AWS users or rotate their access and secret keys. Instead, you can create an IAM role that has permissions to access CloudWatch or Athena and a trust relationship with Grafana’s AWS account. Grafana’s AWS account then makes an STS request to AWS to create temporary credentials to access your AWS data. More information can be found in the AWS authentication docs.
On-call engineers need to be instantly aware when critical incidents occur, even in noisy environments or during deep sleep. The Grafana IRM Mobile App now includes five new high-intensity alarm sounds specifically designed to cut through ambient noise and grab your attention when it matters most.
The new sound collection features aircraft alarms, emergency warnings, fire alarms, loud buzzers, and severe warning alarms - each available in both constant and fade-in variations. These sounds were carefully selected based on customer feedback requesting more effective notification options that ensure alerts are never missed.
The alert rule page has received a total redesign. The new page features a smoother, faster, and more flexible design to help make your alert rule management easier.
The new alert rule page features two views, each with their own uses. The Grouped view is arranged by namespaces, so you can drill down to the specific groups you’re looking for. The List view is a full list of all alert rules, designed for quick searches and easy filtering, which has become much more efficient thanks to recent performance improvements.
The Google Sheets data source just got more powerful! Our 2.2.0 release adds support for template variables, making it easier to build interactive and adaptable dashboards directly from your spreadsheets.
Imagine you have a spreadsheet with sales data for different regions. With template variables, you can add a drop-down menu to your dashboard that lets users select a specific region. The dashboard automatically updates to show only the data for that region.
Grafana now supports Entra Workload Identity, significantly enhancing authentication capabilities with federated credentials. This update simplifies the OAuth flow and improves security for Grafana instances leveraging Microsoft Azure, and was a valuable contribution from an external contributor. Thank you mehiglow.
For more details on configuring Entra ID (formerly known as Azure AD) authentication, please refer to the official documentation.
We’re excited to announce that you can now define custom variables within visualization actions. When you trigger an action (such as an API request), you’ll be prompted to provide input for those variables. This makes actions more dynamic and interactive, allowing you to tailor requests in real time without modifying the dashboard configuration.
This feature is especially useful when actions require user-supplied input upon being triggered. For example, it enables scenarios like setting a thermostat to a specific temperature or entering a problem description when creating a support ticket.
We are announcing the availability of embedded Logs Drilldown within Asserts. This is our second milestone, coming hot off the heels of launching the embedded version of Traces Drilldown in Asserts.
We continue to celebrate and ensure our opinionated experiences can benefit from our best-of-breed signal exploration workflows by making them embeddable in other contexts.
What’s new?
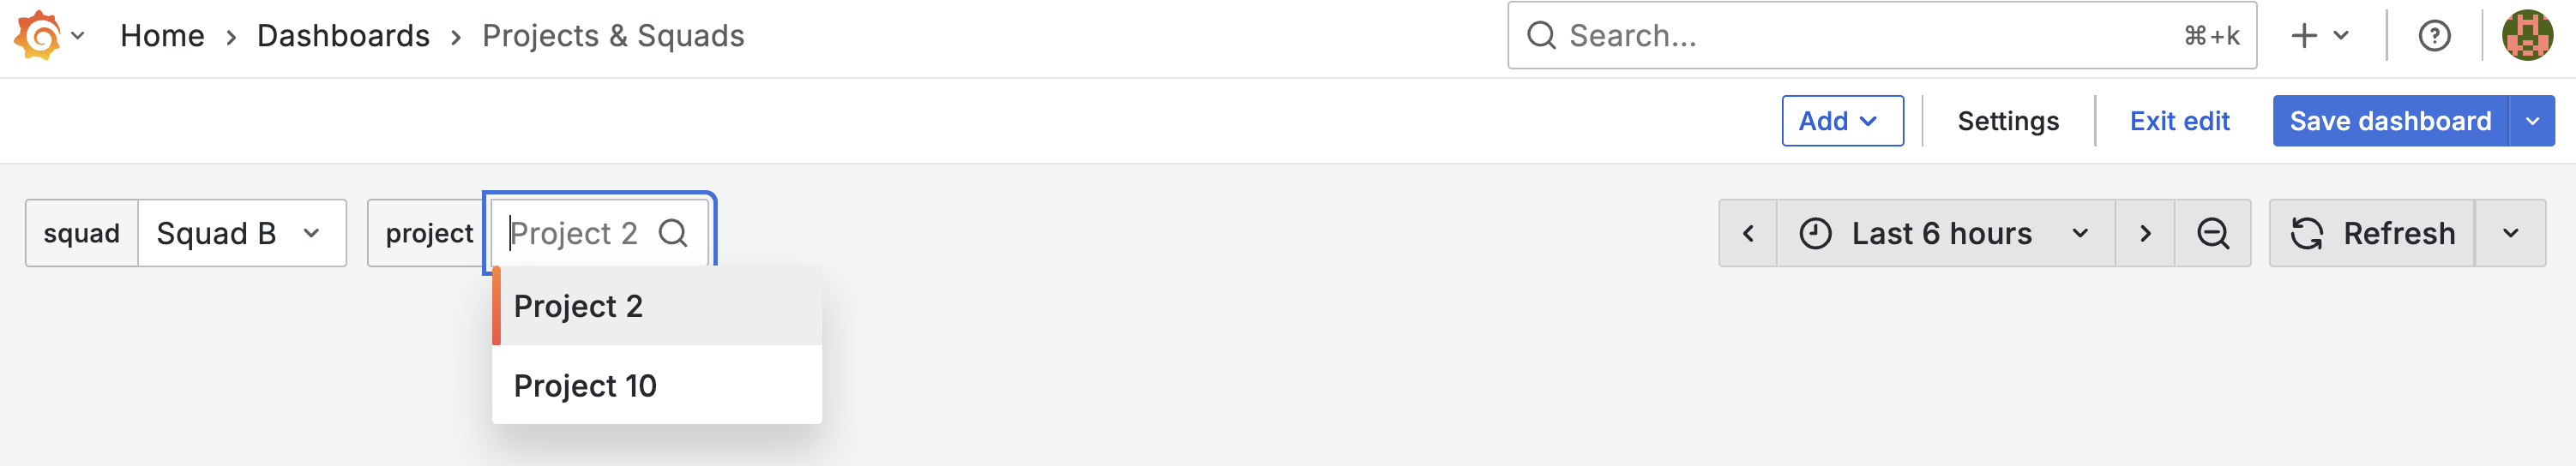
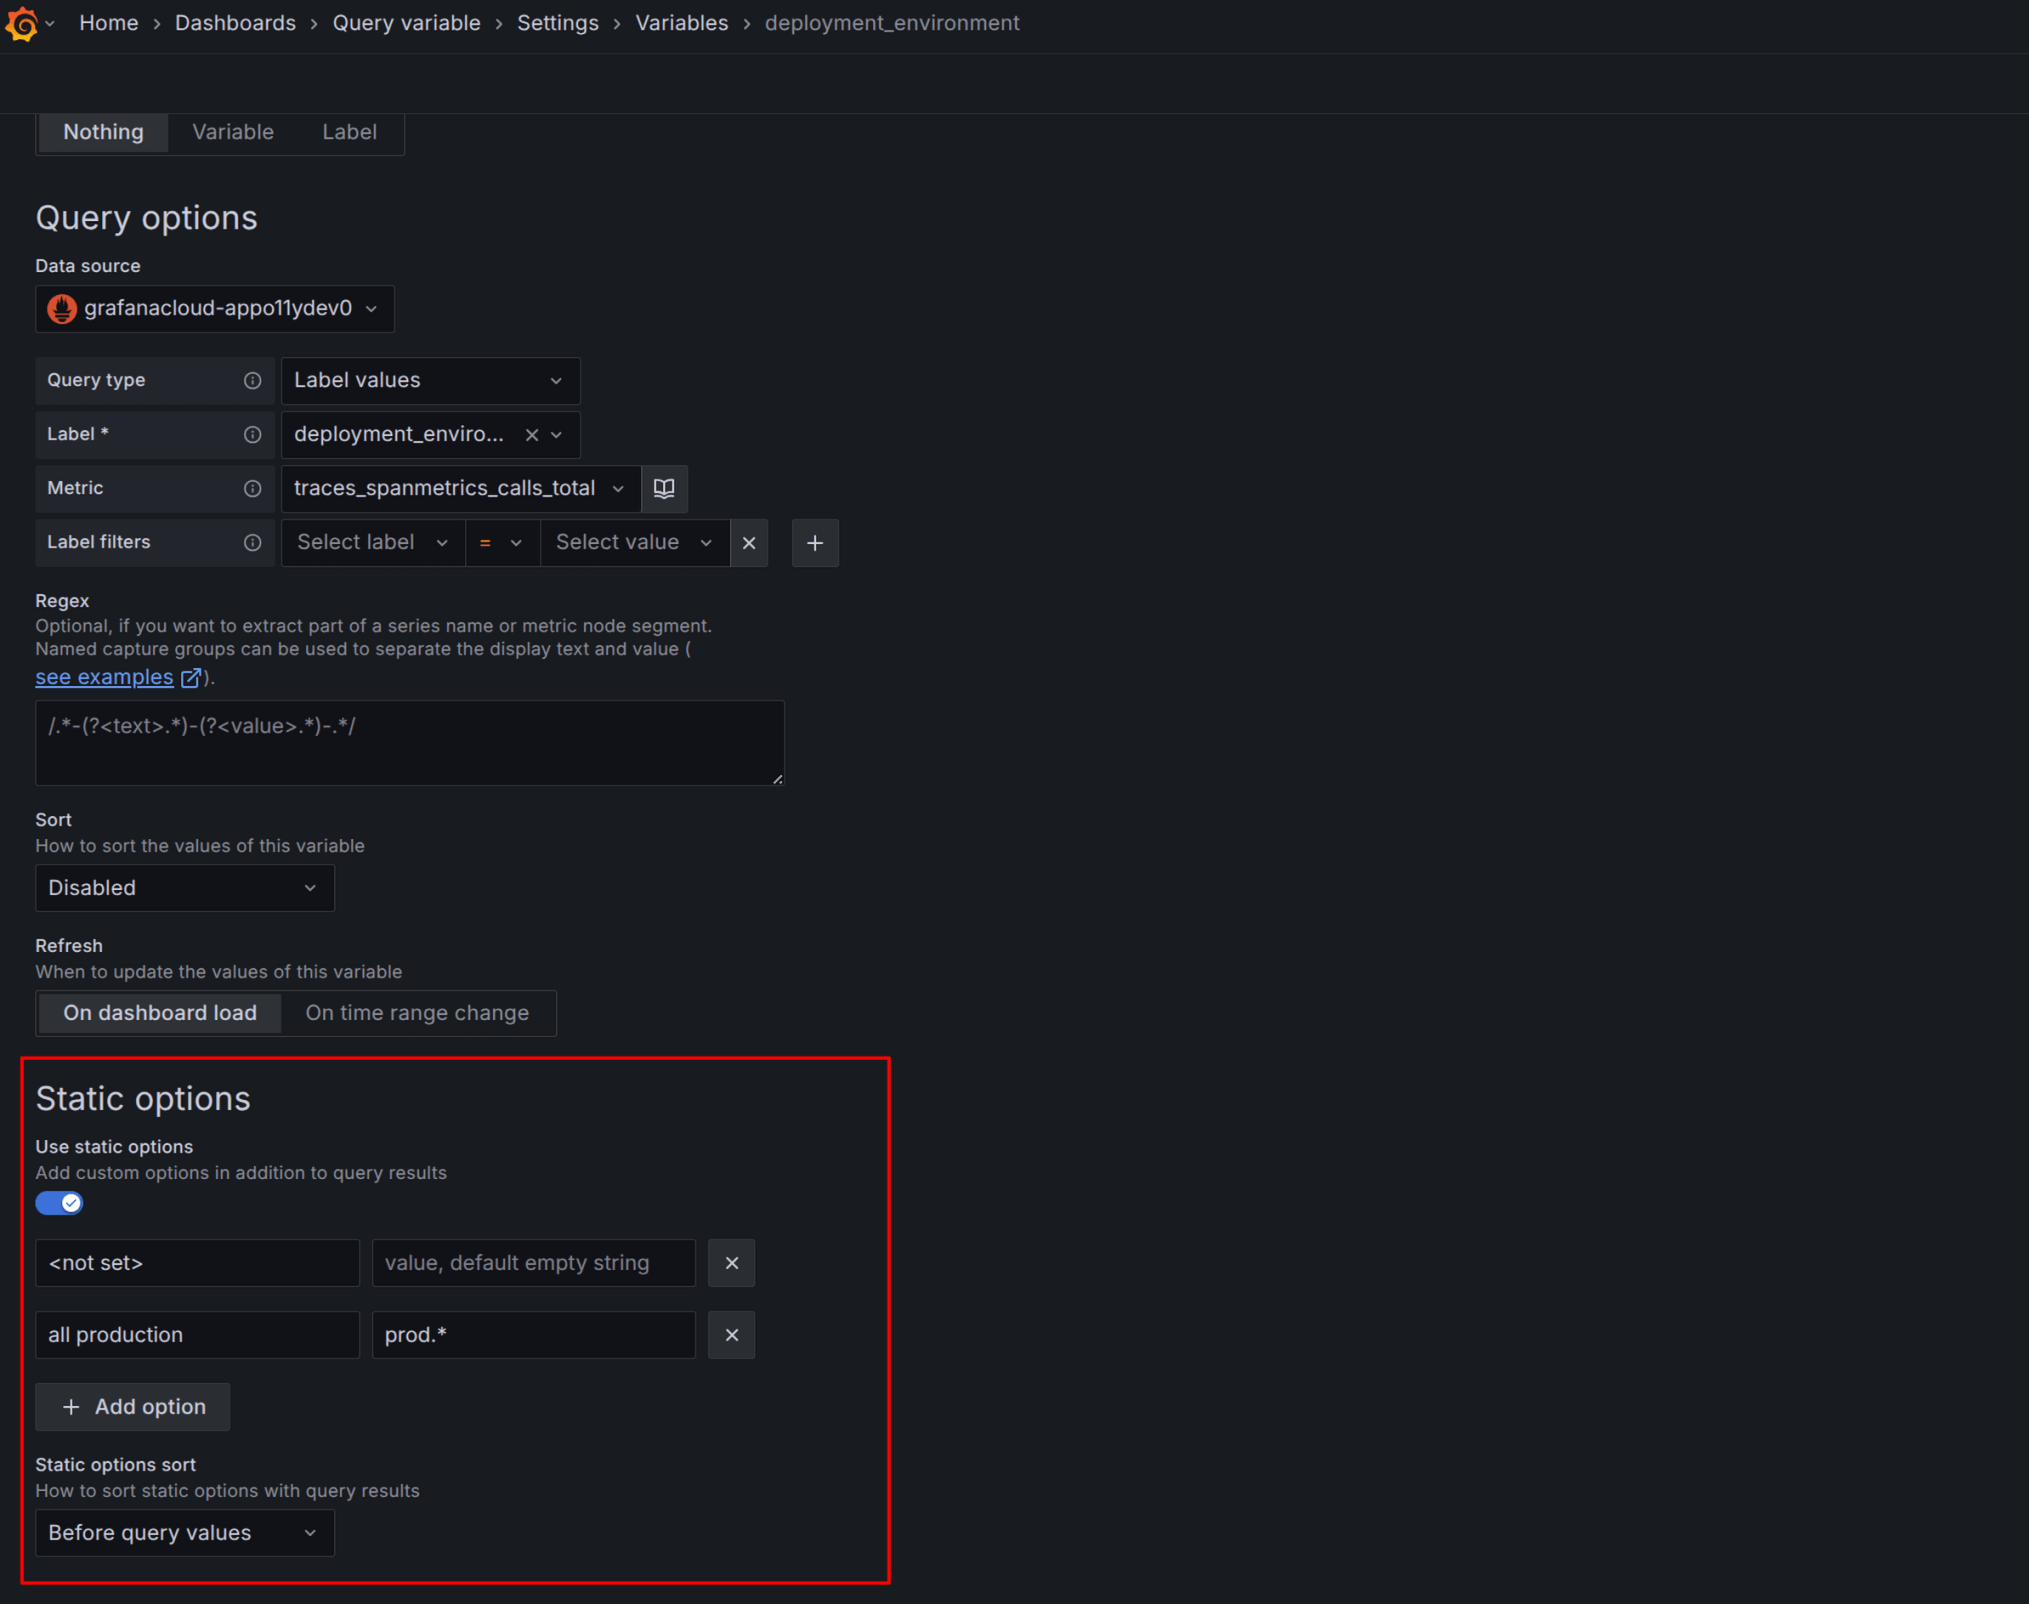
You can now define additional static options for query variables to be included with the options retrieved by querying the data source. This affords you more flexibility, allowing you to create options like “value not set” or “all clusters in Asia”.
Mute Timings have been renamed to Active Time Intervals to better align with their usage.
With auto-apply, you now get all of the benefits of Adaptive Metrics, in a more timely manner. Using auto-apply, recommendations are applied automatically, without a human in the loop. Maximize your cost savings and observability outcomes, and spend less time reviewing recommendations!
Enable auto-apply using the Adaptive Metrics GUI, API, or Terraform provider. Auto-apply also optionally works with segmentation; sub-divide your recommendations to manage on a per-team basis, and choose to auto-apply at a segment level.
The Drilldown Apps are going places! We’re ensuring our opinionated experiences can benefit from our best-of-breed signal exploration workflows by making them embeddable in other contexts. Our first milestone is the integration of Traces Drilldown in the Asserts KPI drawer.
Thanks to Drilldown, you can now spot which dimensions are misbehaving – easily – no more wading through endless trace lists or wrestling with queries. That means dramatically faster MTTR when you need traces to pinpoint root causes!
What’s new?
Introducing the all new user experience for per stream exports in Grafana Cloud Logs.
With per stream export, you can configure Grafana Cloud to export select log streams to your object storage bucket in AWS, Google Cloud, or Azure. By only exporting a subset of your logs, you can significantly reduce your object storage costs and minimize logs needed to sort through after being stored.
Grafana Fleet Management now supports Amazon Web Service (AWS) PrivateLink. You can securely connect your virtual private clouds (VPCs) to Fleet Management APIs without using the public internet.
With AWS PrivateLink, you can:
- Reduce your AWS egress costs.
- Improve security by keeping your data within the Amazon network.