
What's new from Grafana Labs
Grafana Labs products, projects, and features can go through multiple release stages before becoming generally available. These stages in the release life cycle can present varying degrees of stability and support. For more information, refer to release life cycle for Grafana Labs.
Loading...
Area of interest:
Cloud availability:
Cloud editions:
Self-managed availability:
Self-managed editions:
No results found. Please adjust your filters or search criteria.
There was an error with your request.
We’ve improved the reporting experience with options to make all of your table data accessible in PDFs. Previously, if your dashboard included large table visualizations, you couldn’t see all of the table data in your PDF report. Unlike in Grafana, you couldn’t scroll in the PDF table visualization or click on the page numbers. With this new feature, you now have the option to see all the data directly in your PDF without losing your dashboard layout.
You can add an expiration date when you create a Grafana Access Policy token during the easy configuration process of Kubernetes Monitoring. The permission scope of the token also displays as you configure.
Sumo Logic enterprise data source plugin for Grafana lets users query metrics and logs from their Sumo Logic instance.
Plugin is already live in v 1.0

We’ve added two new features to transformations in Grafana, to help you make sense of your data.
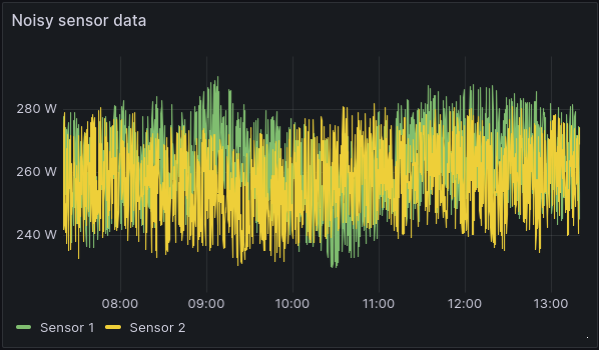
Moving average
Sometimes your data is too noisy to quickly grasp what’s going on. A common way to address this issue is to calculate the moving mean, or moving average, to filter out some of that noise. Luckily, many data sources already support calculating the moving mean, but when the support is lacking or you’re not well versed in the query language, until now, you were stuck with the noise.
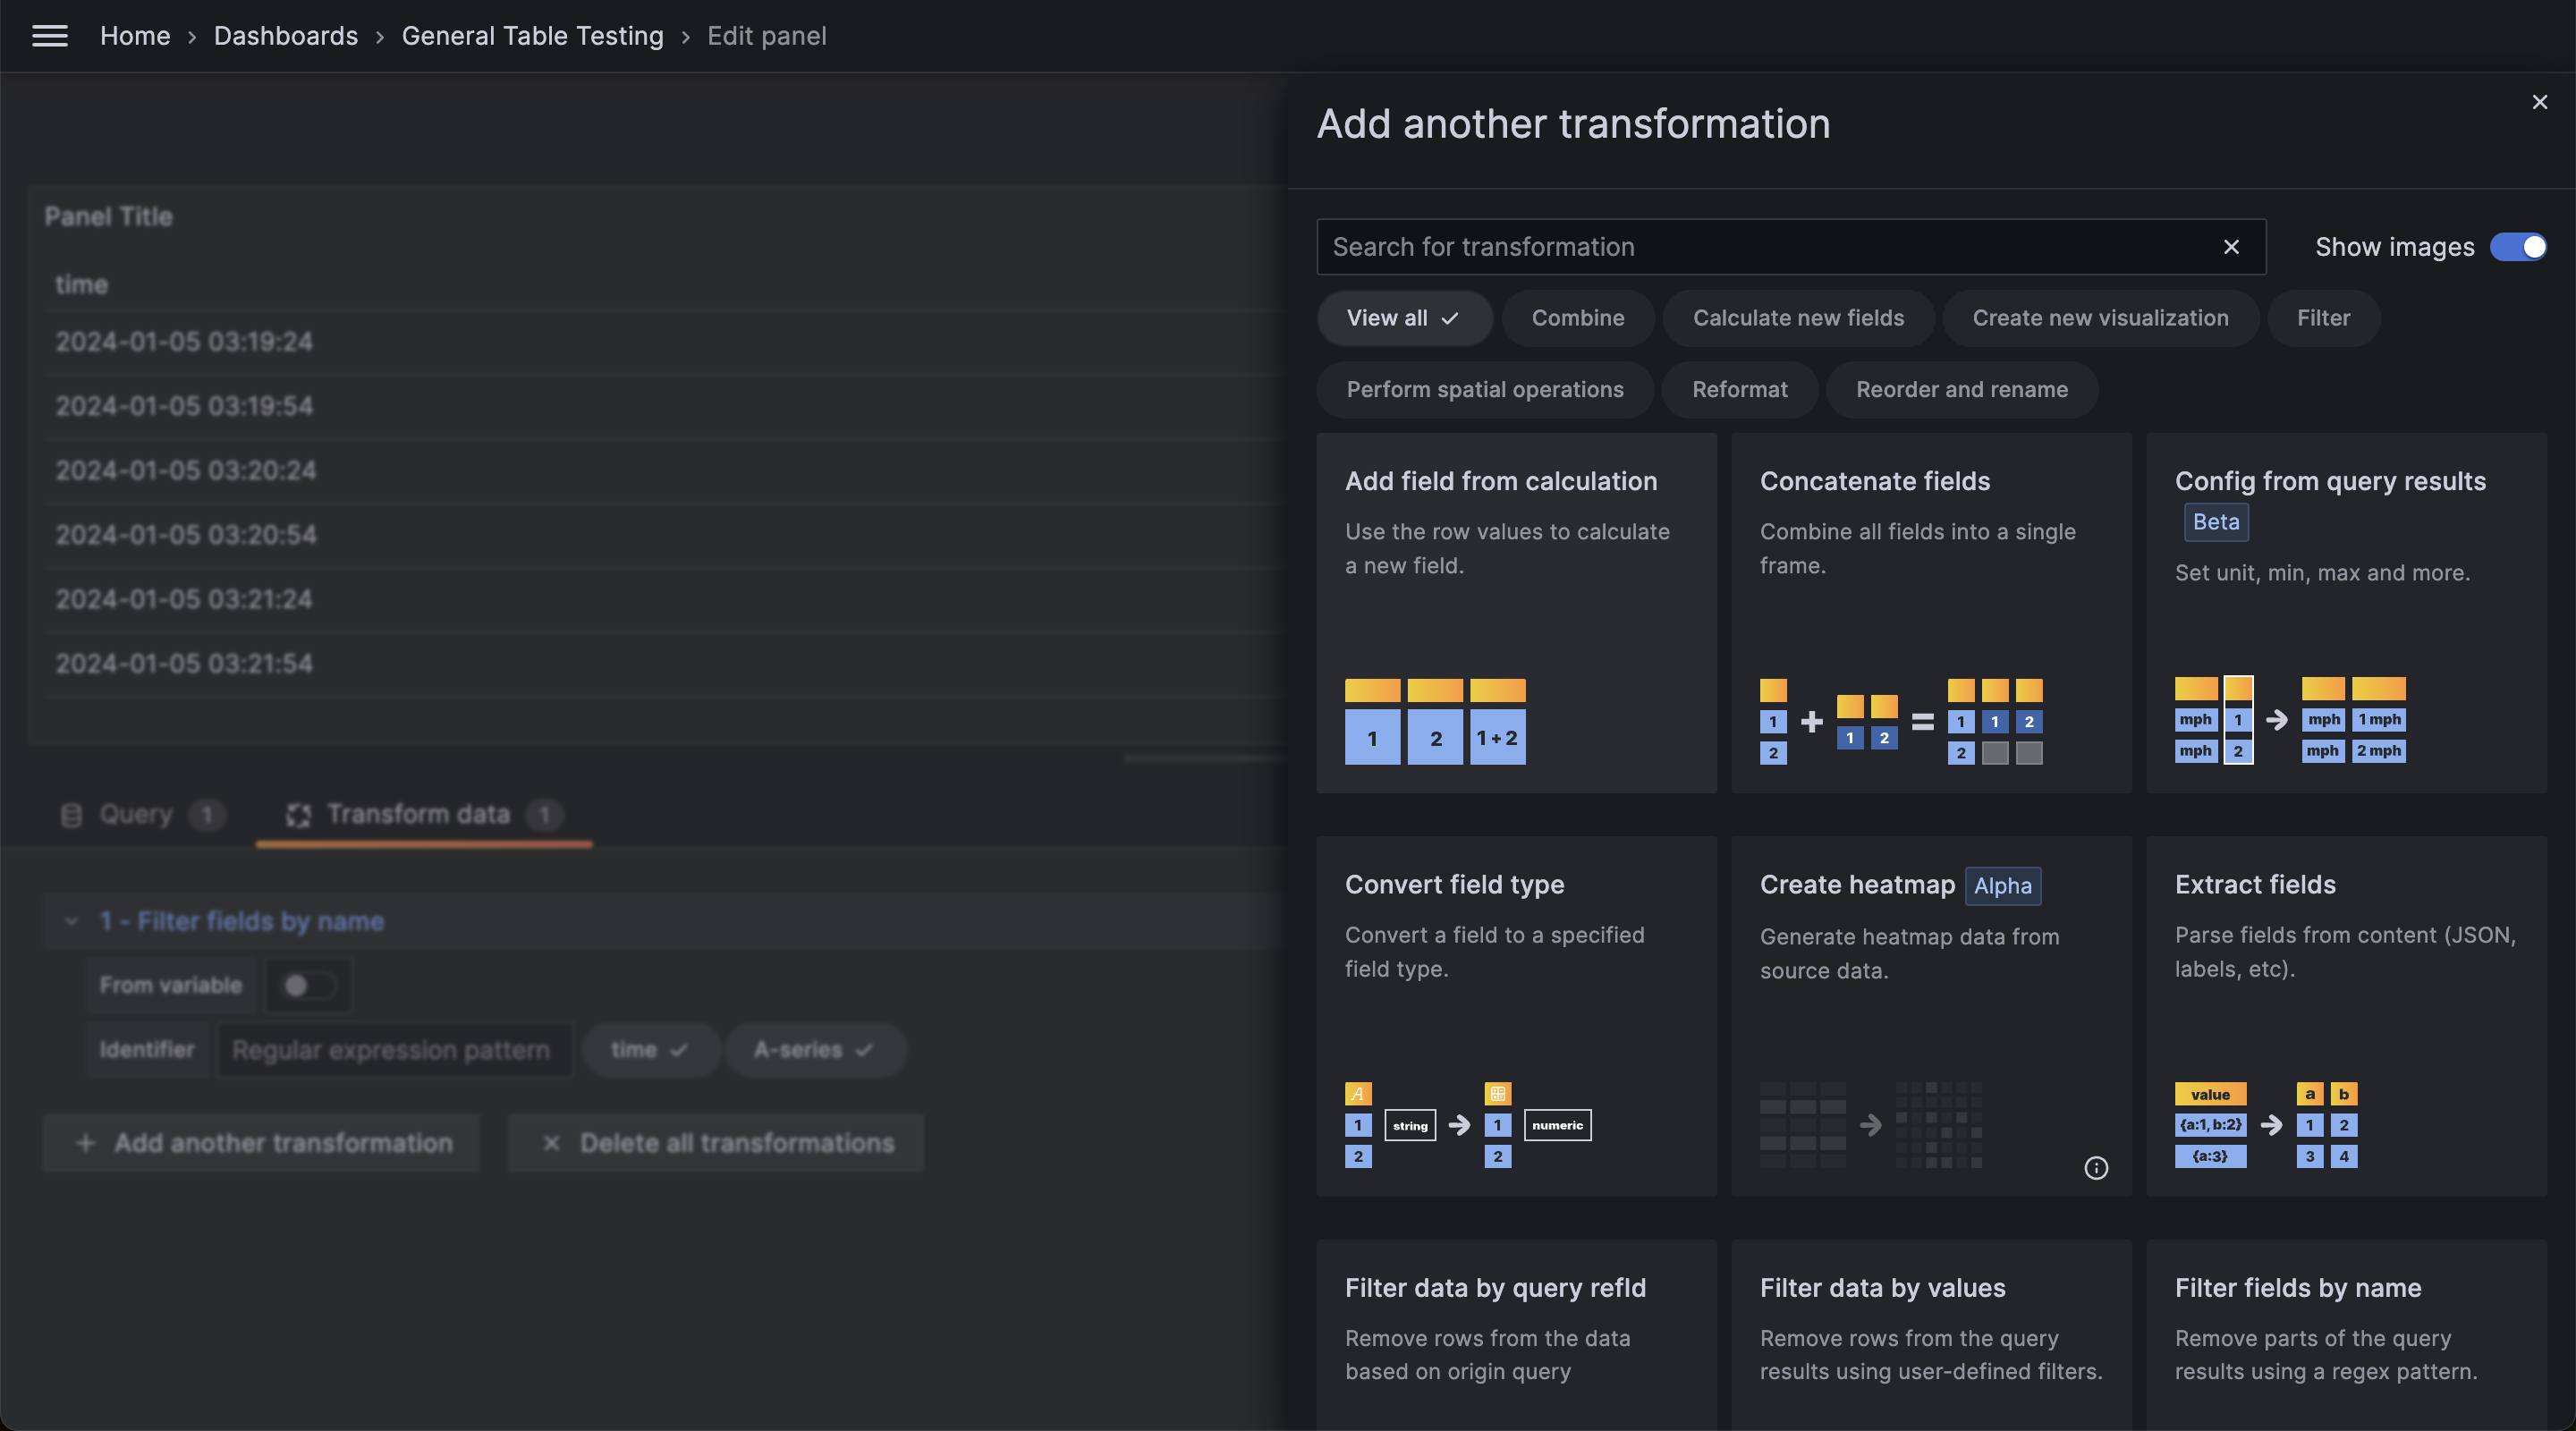
We’ve revamped the Transformations user interface to make it cleaner, more user-friendly, and overall better for visualizing, selecting, and comprehending transformation options for your data.
Introducing query caching for async queries in the Athena and Redshift data source plugins. We previously introduced async queries for the Athena and Redshift plugins, and this feature adds support for caching those queries. To use this, you must have query caching enabled for the Athena or Redshift data source you wish to cache. This feature was previously available behind a feature toggle and is now generally available and enabled by default.
To reduce the noise of flapping alerts, you can set a recovery threshold different to the alert threshold.
Flapping alerts occur when a metric hovers around the alert threshold condition and may lead to frequent state changes, resulting in too many notifications being generated.
Introducing several improvements to the Loki data source.
Line filter “or” syntax
Loki’s line filter syntax is great to find specific substrings of your log lines. If users want to find multiple different substrings it was cumbersome to use the regex =~ operator. With this change it is possible to chain multiple strings with the existing filter operators.
You can now apply data transformations to annotation data. For example, you can now configure how exemplar data is displayed in tooltips.
Canvas visualizations now support panning and zooming. This allows you to both create and navigate more complex designs.
To enable this feature, you must first enable the canvasPanelPanZoom feature toggle.
We’ve introduced enhanced tooltips as part of our standardization initiative, unifying the tooltip architecture for a consistent user experience across panels. Packed with features like color indicators, time uniformity, and improved support for long labels, these tooltips go beyond a cosmetic redesign, bringing fundamental changes to elevate your data visualization experience. Stay tuned for more updates!
You can now plot enum values in your time series and state timeline visualizations. This feature is useful when you want to visualize the state of a system, such as the status of a service or the health of a device. For example, you can use this feature to visualize the status of a service as ON, STANDBY, or OFF. To display enum values you can use the convert field transform.
You can now view percent change in stat visualizations. This makes it easier to understand your data by showing how metrics are changing over time.
Introducing Multi-Stack Data Sources
It’s complicated to query across multiple data sources if you store your metrics or logs across separate tenants.
Multi-stack data sources lets you set up one data source that includes multiple tenants, ensuring simpler faster queries.
We’ve identified a need for users who enable anonymous authentication to monitor the anonymous devices connected to their Grafana instance. This feature is part of our ongoing efforts to enhance control and transparency regarding anonymous usage.