What's new from Grafana Labs
Grafana Labs products, projects, and features can go through multiple release stages before becoming generally available. These stages in the release life cycle can present varying degrees of stability and support. For more information, refer to release life cycle for Grafana Labs.
Loading...
Area of interest:
Cloud availability:
Cloud editions:
Self-managed availability:
Self-managed editions:
No results found. Please adjust your filters or search criteria.
There was an error with your request.
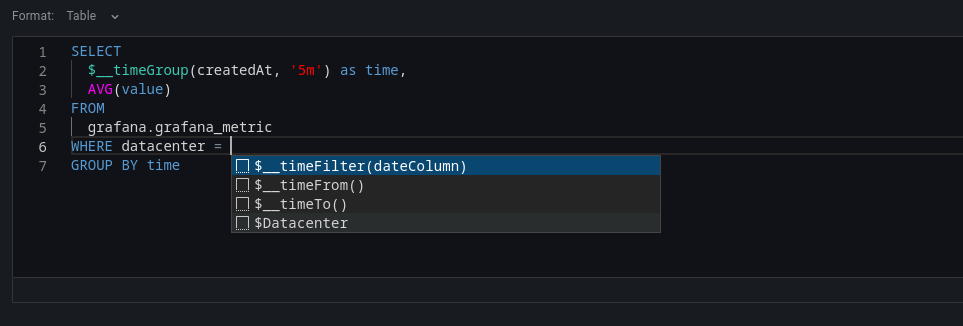
New for the Databricks datasource plugin is the schema aware SQL query builder to help you build faster queries. For general documentation on querying data sources in Grafana, see Query and transform data.
With Kubernetes Monitoring, you can effectively identify, prioritize, and handle efficiency-related issues. Efficiency data is available globally, and your troubleshooting path enables you to create an efficiency feedback loop.
The SLO App generates dashboards to help user pinpoint where they are burning their error budget, in which clusters, for example, by supporting multidimensional SLOs (SLOs that preserve one or more dimensions / label-values). The dashboards that help identify in which dimension the SLI is underperforming were previously only available for ratio-type SLOs or SLO expressions that were fairly simple.
Using Static IPs with k6 allows you to know which IP addresses will be used by the cloud instances generating load during your test runs. This allows you to whitelist these IP addresses only. Knowing the IP addresses that are used can make it easier to identify logs and traffic created specifically by the k6 load tests.
Administrators are now able to directly install, update and uninstall plugins from within Grafana itself, removing the need to switch context and navigate to Grafana.com. This makes it easier than ever to manage plugins in your Grafana Cloud instance and reduces the risk of attempting to install plugins which are incompatible with your Grafana configuration.
When you’re browsing Grafana - for example, exploring the dashboard and metrics related to an alert - it’s easy to end up far from where you started and hard get back to where you came from. The ‘Return to previous’ button is an easy way to go back to the previous context, like the alert rule that kicked off your exploration. This first release works for Alerts, and we plan to expand to other apps and features in Grafana in future releases to make it easier to navigate around.
Copying and pasting time range in the time range picker is now available. For example, you can copy a time range in Explore and paste it into Dashboards and vice versa. You can also copy and paste a time range using the new keyboard shortcuts t+c and t+v, respectively.
The Opsgenie contact point has been extended to allow users to optionally fill out responder information for their integration. Responders tell Opsgenie who an alert should notify according to their escalation policies and routing rules.
InfluxDB introduced a new version, 3.0, in April. With this new version, InfluxDB has put Flux in maintenance mode. But with the new version we have a new querying language, Native SQL. With v10.3.0, Grafana has built-in support for SQL query language in InfluxDB.
New in Explore, more options for sharing your query results! The time picker in Grafana has always had two categories - relative (for example, now to 2 hours ago) and absolute (8am to 10am). Explore has allowed people to copy links and create short links with exactly what their time picker had set, but now additionally you have the option to get a link or create a short link with the time range made absolute, even if you are viewing relative time. This means whoever looks at your link will see exactly the data you are seeing, no matter when they open the link. This is available as a dropdown next to the existing shortlink button in Explore.
We’ve improved the reporting experience with options to make all of your table data accessible in PDFs. Previously, if your dashboard included large table visualizations, you couldn’t see all of the table data in your PDF report. Unlike in Grafana, you couldn’t scroll in the PDF table visualization or click on the page numbers. With this new feature, you now have the option to see all the data directly in your PDF without losing your dashboard layout.
You can add an expiration date when you create a Grafana Access Policy token during the easy configuration process of Kubernetes Monitoring. The permission scope of the token also displays as you configure.
Sumo Logic enterprise data source plugin for Grafana lets users query metrics and logs from their Sumo Logic instance.
Plugin is already live in v 1.0

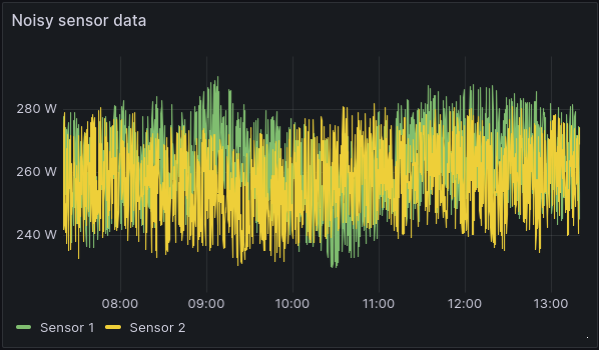
We’ve added two new features to transformations in Grafana, to help you make sense of your data.
Moving average
Sometimes your data is too noisy to quickly grasp what’s going on. A common way to address this issue is to calculate the moving mean, or moving average, to filter out some of that noise. Luckily, many data sources already support calculating the moving mean, but when the support is lacking or you’re not well versed in the query language, until now, you were stuck with the noise.