
What's new from Grafana Labs
Grafana Labs products, projects, and features can go through multiple release stages before becoming generally available. These stages in the release life cycle can present varying degrees of stability and support. For more information, refer to release life cycle for Grafana Labs.
Loading...
Area of interest:
Cloud availability:
Cloud editions:
Self-managed availability:
Self-managed editions:
No results found. Please adjust your filters or search criteria.
There was an error with your request.
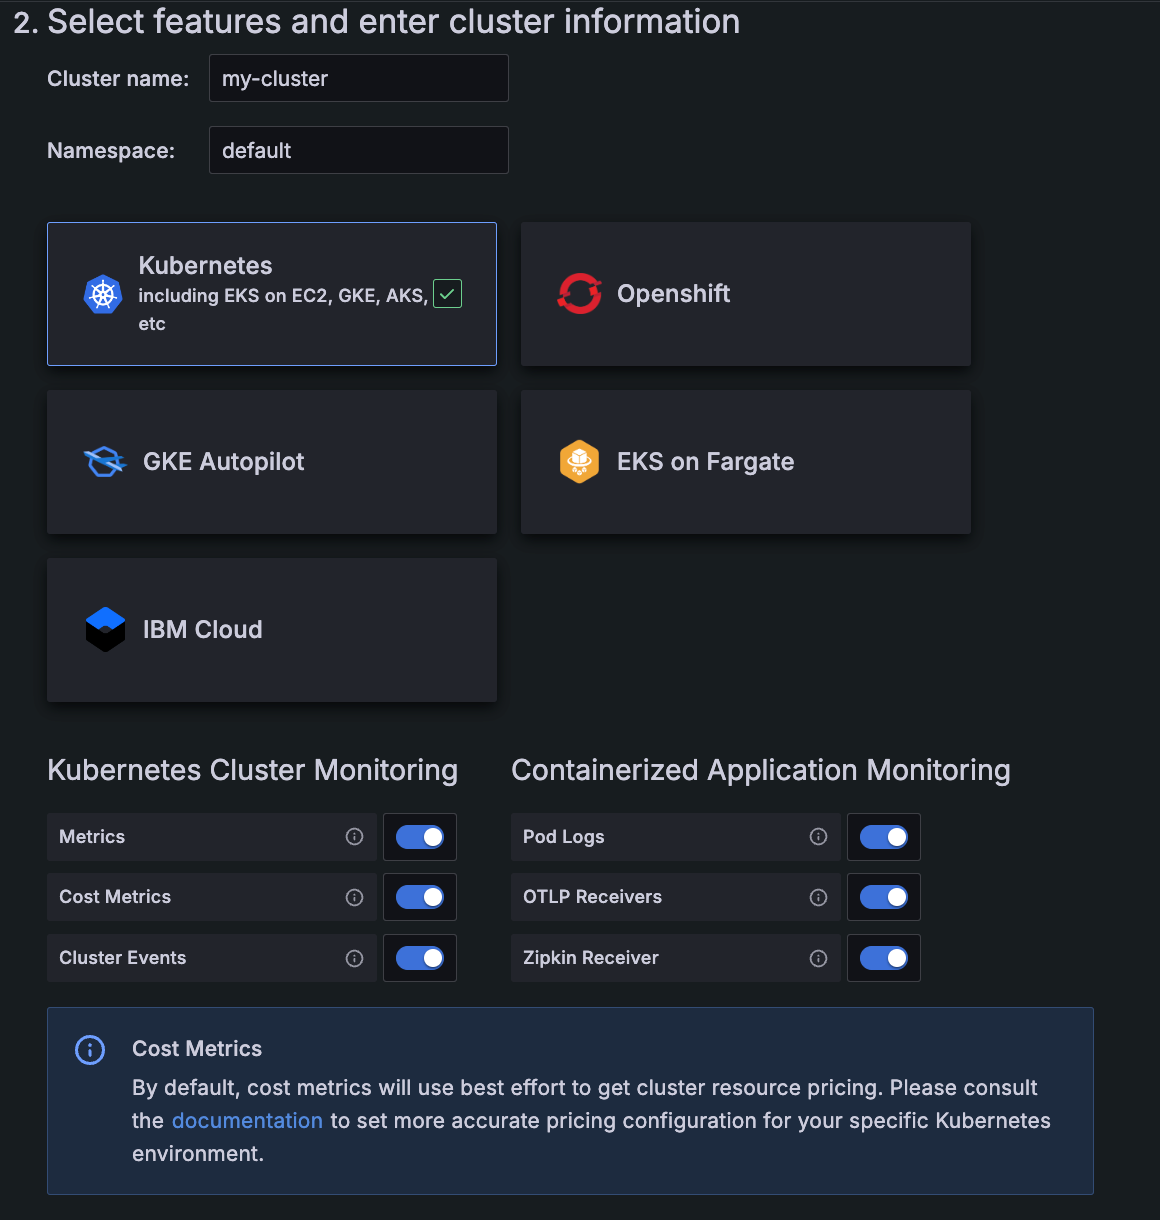
When you use the easy configuration process with Grafana Kubernetes Monitoring Helm chart, you can switch on the use of OTLP and Zipkin receivers for containerized application monitoring.
Click the Explore icon to view the query and additional tools available for you to further explore and query your data.
You can explore a query from the Metrics status tab.
Users looking to migrate to the new Grafana Alerting product can do so with confidence with the Grafana Alerting migration preview tool. The migration preview tool allows users to view, edit, and delete migrated rules prior cutting over, with the option to roll back to Legacy Alerting.
Grafana Alerting previously evaluated rules at the start of the evaluation interval. This created a sudden spike of resource utilization, impacting data sources. Rule evaluation is now spread over the entire interval for smoother performance utilization of data sources.
We’ve added the option to manage library panel permissions through role-based access control (RBAC). With this feature, you can choose who can create, edit, and read library panels. RBAC provides a standardized way of granting, changing, and revoking access when it comes to viewing and modifying Grafana resources, such as dashboards, reports, and administrative settings.
This feature simplifies your options for configuring where your notifications are sent when an alert rule fires. Choose an existing contact point directly from within the alert rule creation form without the need to label match notification policies. You can also set optional muting, grouping, and timing settings directly in the alert rule.
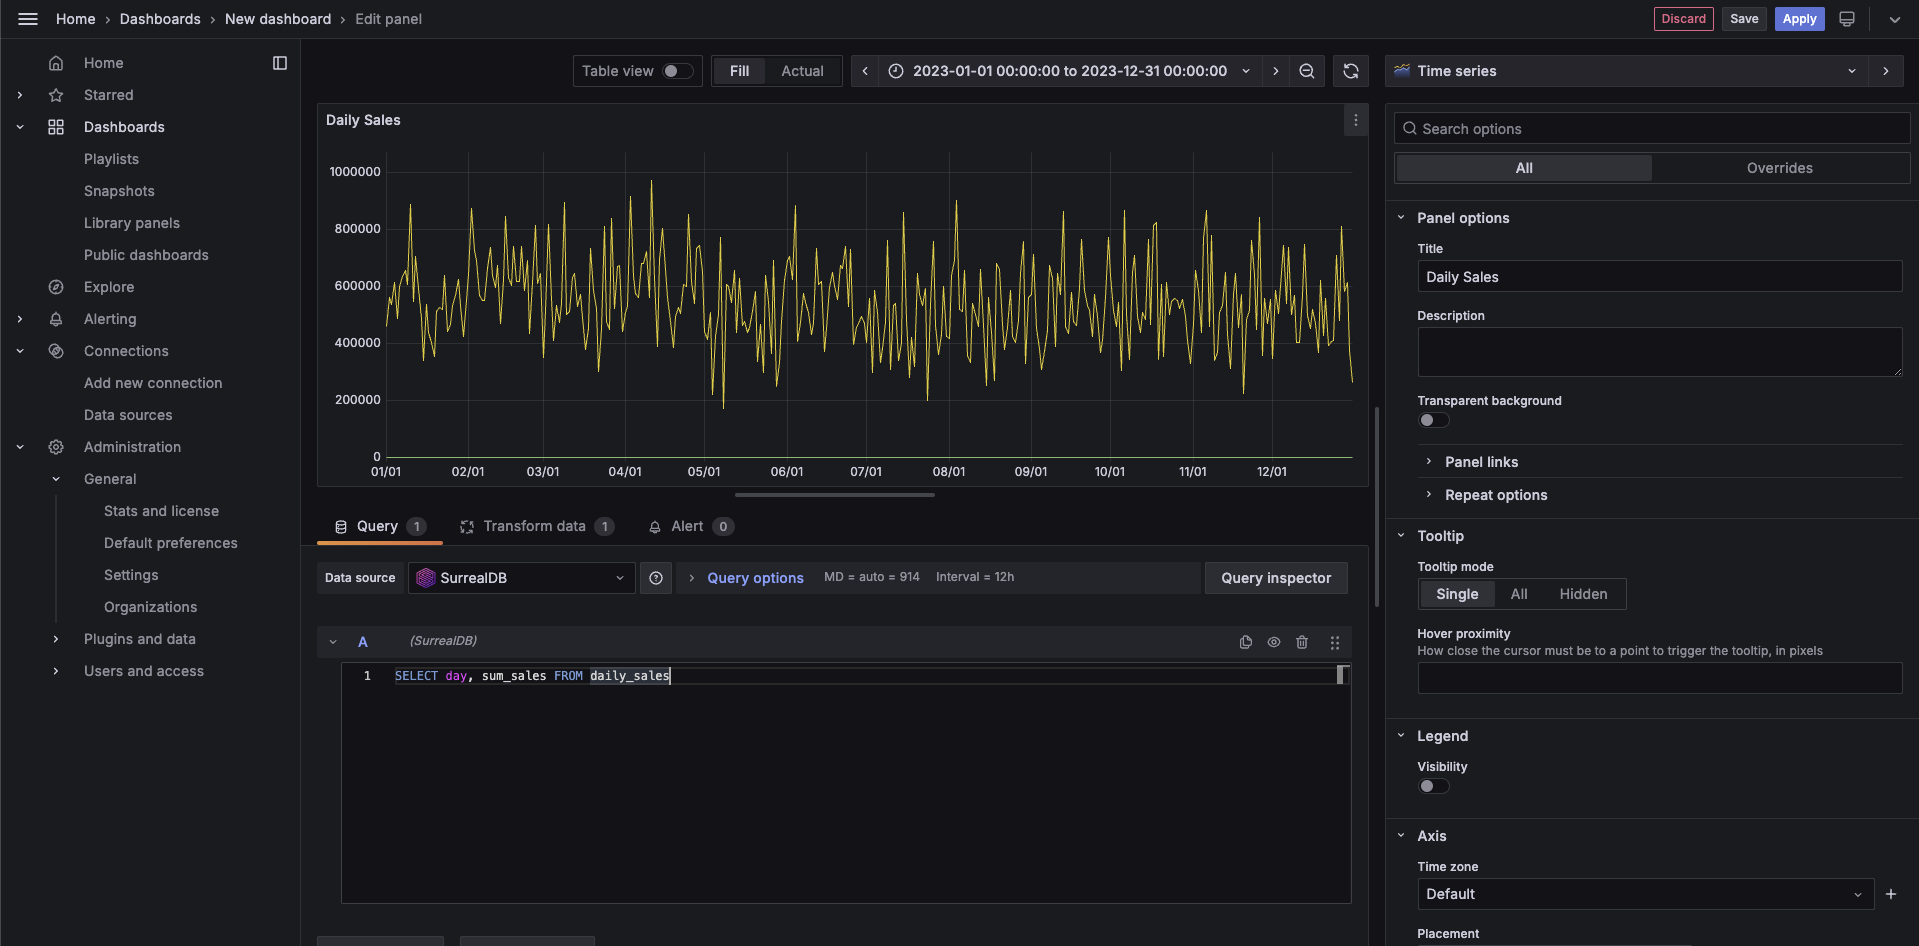
A SurrealDB data source has been added to the Plugin Catalog, enabling the integration of SurrealDB, a real-time, multi-model database, with Grafana’s visualization capabilities. This datasource allows users to directly query and visualize data from SurrealDB within Grafana, using SurrealDB’s query language.
The table visualization for logs, announced in public preview for Grafana 10.3, is generally available in Cloud (all editions) and with Grafana 10.4.
New to the table visualization with 10.4:
Grafana can now be used to manage both Prometheus and Mimir Alertmanagers with UTF-8 configurations. For more information, please see the release notes for Alertmanager 0.27.0.
AngularJS support in Grafana was deprecated in v9 and will be turned off by default in Grafana v11. When this happens, any plugin which depended on AngularJS will not load, and dashboard panels will be unable to show data.
This update to the Filter data by values transformation simplifies data filtering by enabling partial string matching on field values thanks to two new matchers: Contains substring and Does not contain substring. With the substring matcher built into the Filter data by values transformation, you can efficiently filter large datasets, displaying relevant information with speed and precision. Whether you’re searching for keywords, product names, or user IDs, this feature streamlines the process, saving time and effort while ensuring accurate data output.
The Log Volume Explorer has been promoted to General Availability! First announced at ObsCon London in Nov 2023, the Log Volume Explorer adds to our set of features that help you manage your observability spend. Identify the source of logs ingested into Grafana Cloud and answer questions like “Which of my teams, environments, Kubernetes clusters, and/or applications are generating the most logs?” Find the Log Volume Explorer under Administration > Cost Management > Logs.
Are you a k8s user? Do your requirements involve testing internal services or generating load from inside your network? Private Load Zones are a new feature of Grafana Cloud k6 that allow you to run k6 load generators from your k8s cluster and push metrics to Grafana Cloud and visualize them in the Grafana Cloud k6 app plugin.
Save money and apply an extra layer of network security by using Azure Private Link to send metrics, logs, traces, and profiles to Grafana Cloud.
Subfolders are here at last!
Some of you want subfolders in order to keep things tidier. It’s easy for dashboard sprawl to get out of control, and setting up folders in a nested hierarchy helps with that.