What's new from Grafana Labs
Grafana Labs products, projects, and features can go through multiple release stages before becoming generally available. These stages in the release life cycle can present varying degrees of stability and support. For more information, refer to release life cycle for Grafana Labs.
Loading...
Area of interest:
Cloud availability:
Cloud editions:
Self-managed availability:
Self-managed editions:
No results found. Please adjust your filters or search criteria.
There was an error with your request.
Subfolders are here at last!
Some of you want subfolders in order to keep things tidier. It’s easy for dashboard sprawl to get out of control, and setting up folders in a nested hierarchy helps with that.
If you’ve wanted to visualize your Grafana Cloud k6 test results in a dashboard you’ve been limited to displaying data as a time series. But sometimes a single number is more digestible and can help you make an assessment of your test results quicker.
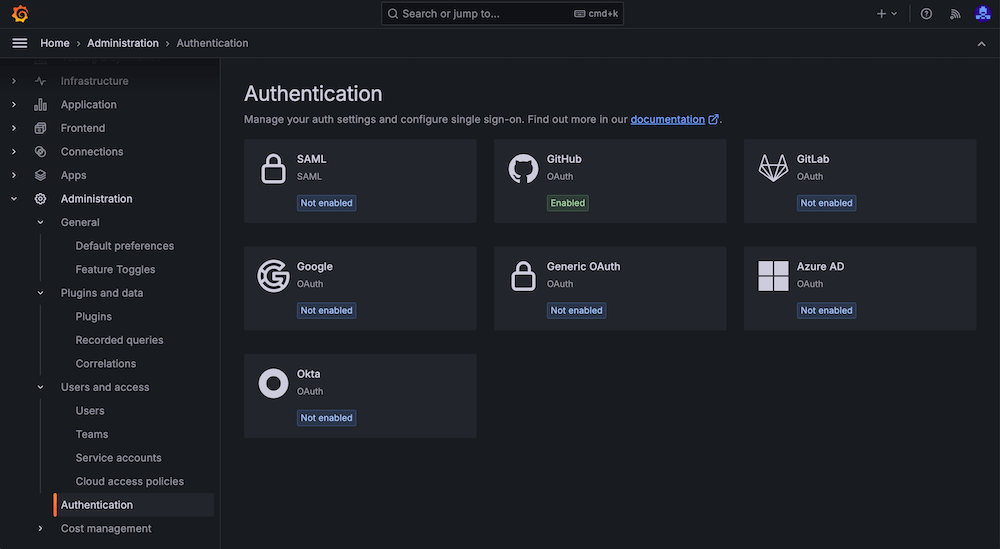
Configuring OAuth providers was a bit cumbersome in Grafana: Grafana Cloud users had to reach out to Grafana Support, self-hosted users had to manually edit the configuration file, set up environment variables, and then they had to restart Grafana. On Cloud, the Advanced Auth page is there to configure some of the providers, but configuring Generic OAuth hasn’t been available until now and there was no way to manage the settings through the Grafana UI, nor was there a way to manage the settings through Terraform or the Grafana API.
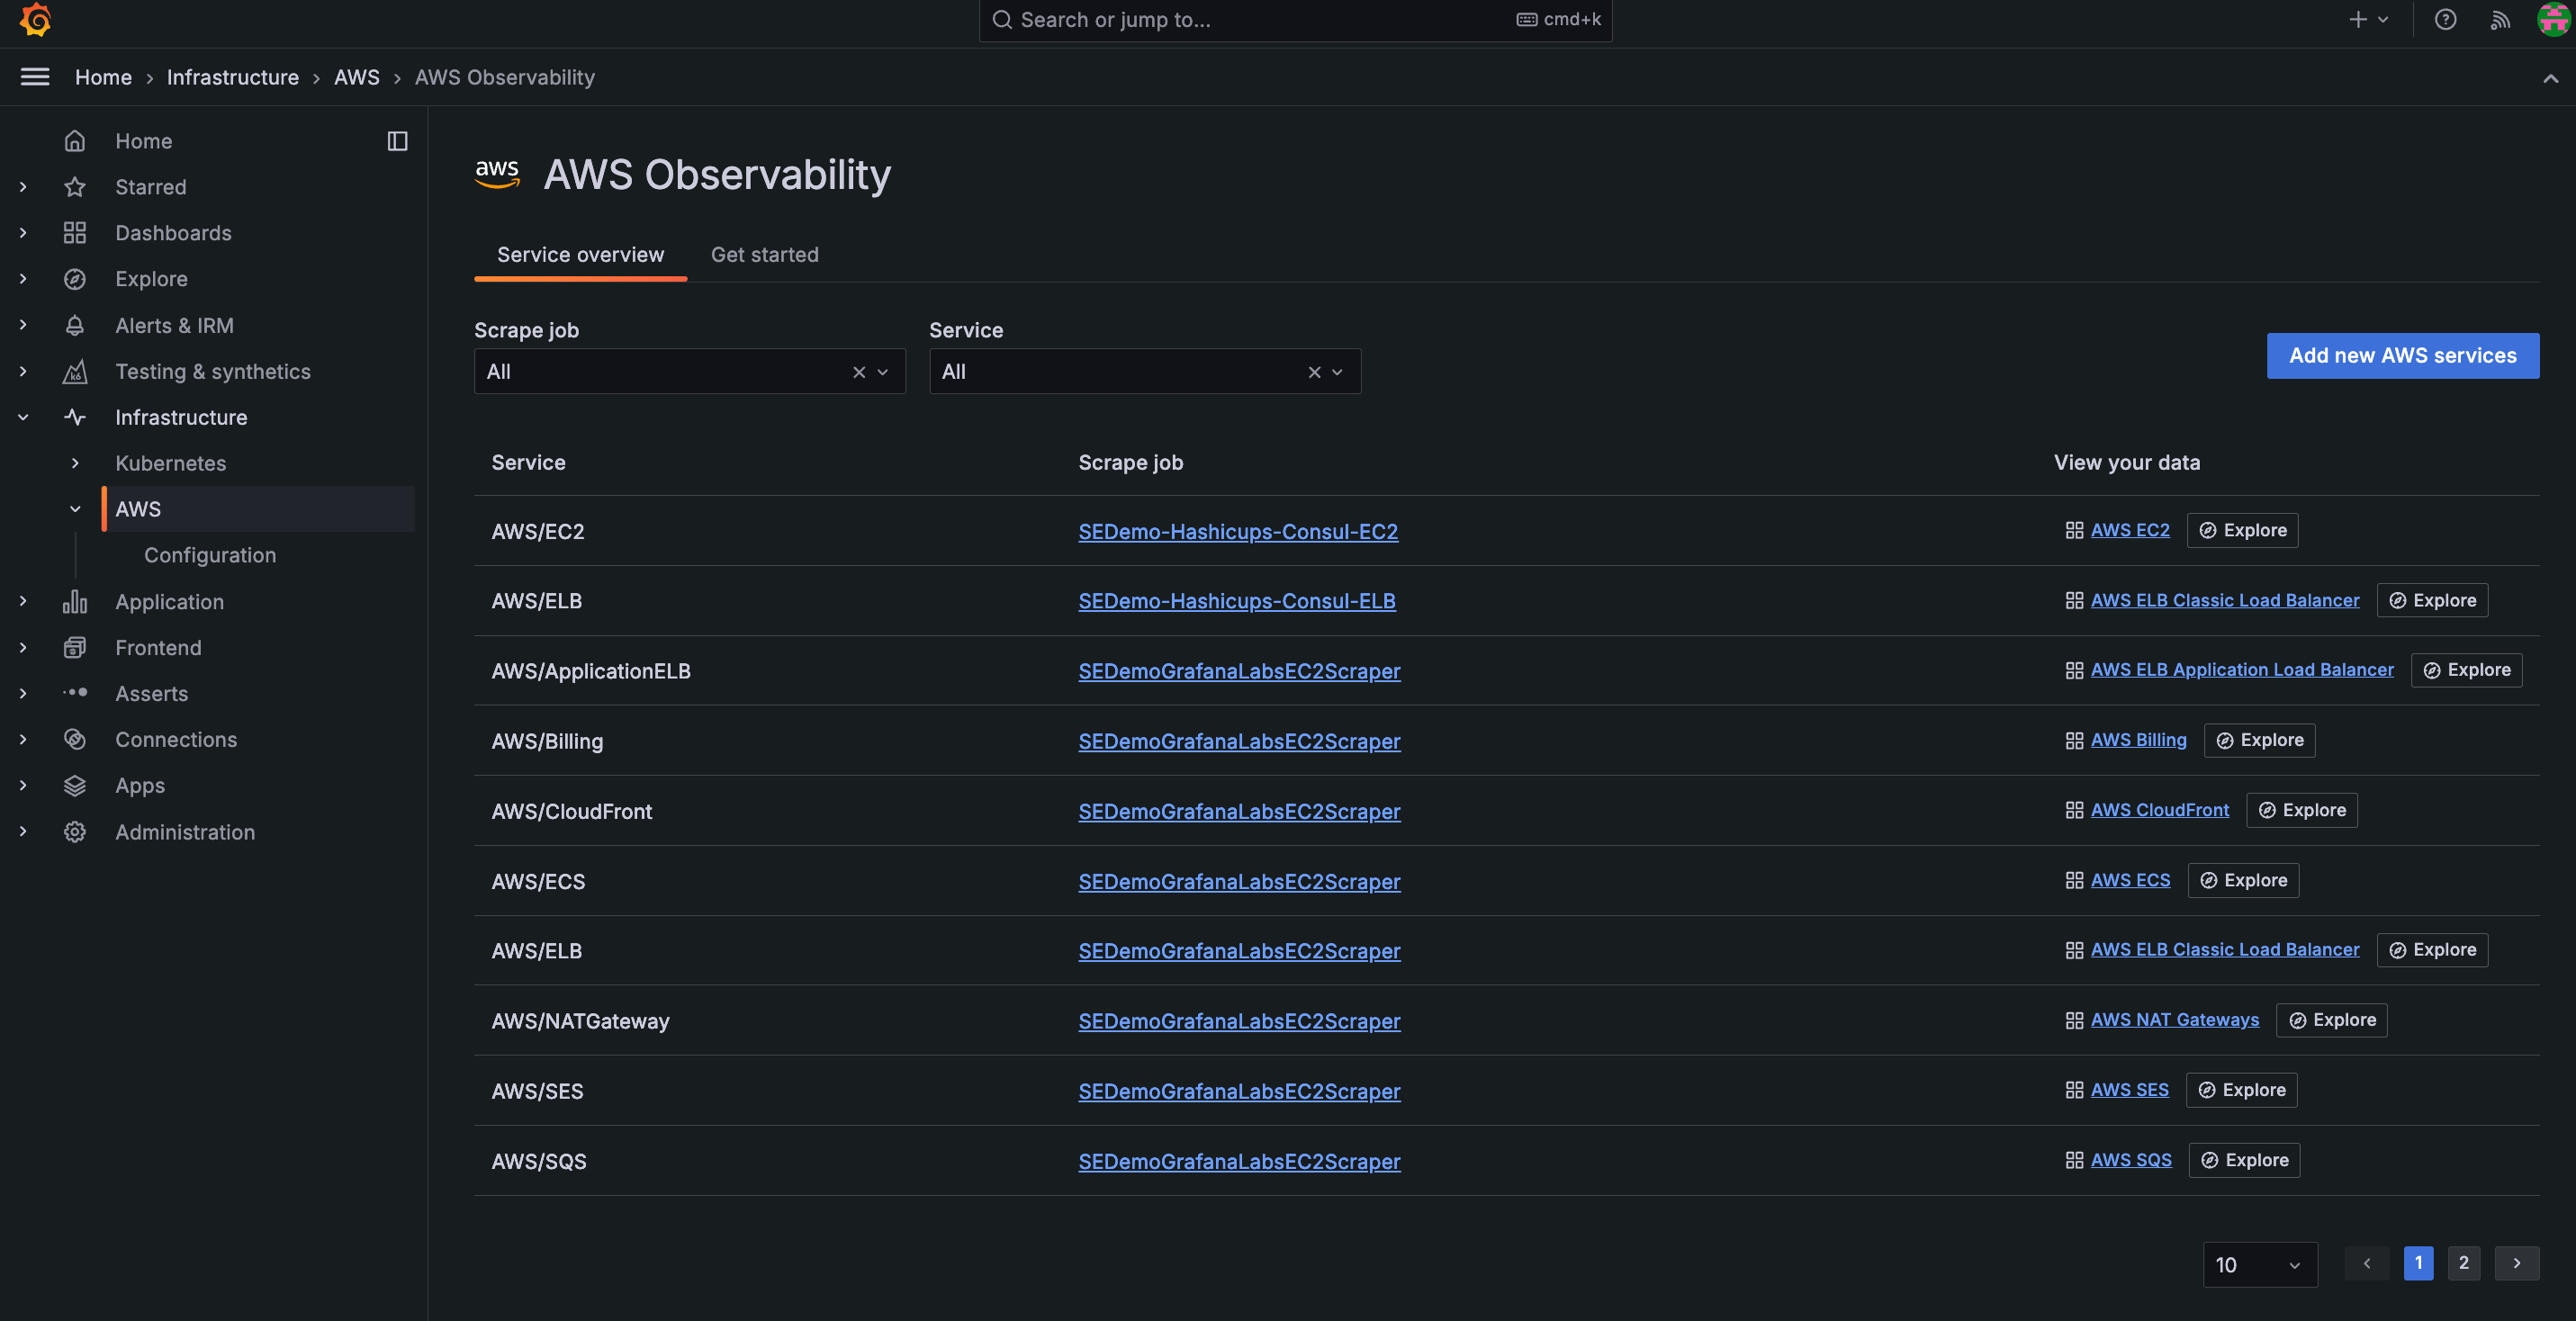
It’s hard to diagnose and resolve issues when your observability data is dispersed across many systems, which can lead to longer times to troubleshoot. Grafana’s AWS Observability provides a centralized location to work with critical observability data so you can fully understand the state of your systems. You can:
You can choose to configure manually, or use a more streamlined configuration process with CloudFormation or Terraform. To send CloudWatch metrics to Grafana Cloud, you:
- Connect to your AWS account.
- Configure the connection between Grafana Cloud and your AWS account.
- Continue configuration with either CloudFormation or Terraform.
- Choose what service to monitor, what metrics to gather, the scrape interval, and what statistics to gather.
- Add any custom namespaces you want to monitor.
![Metrics configuration]()
You can also edit or delete scrape jobs.
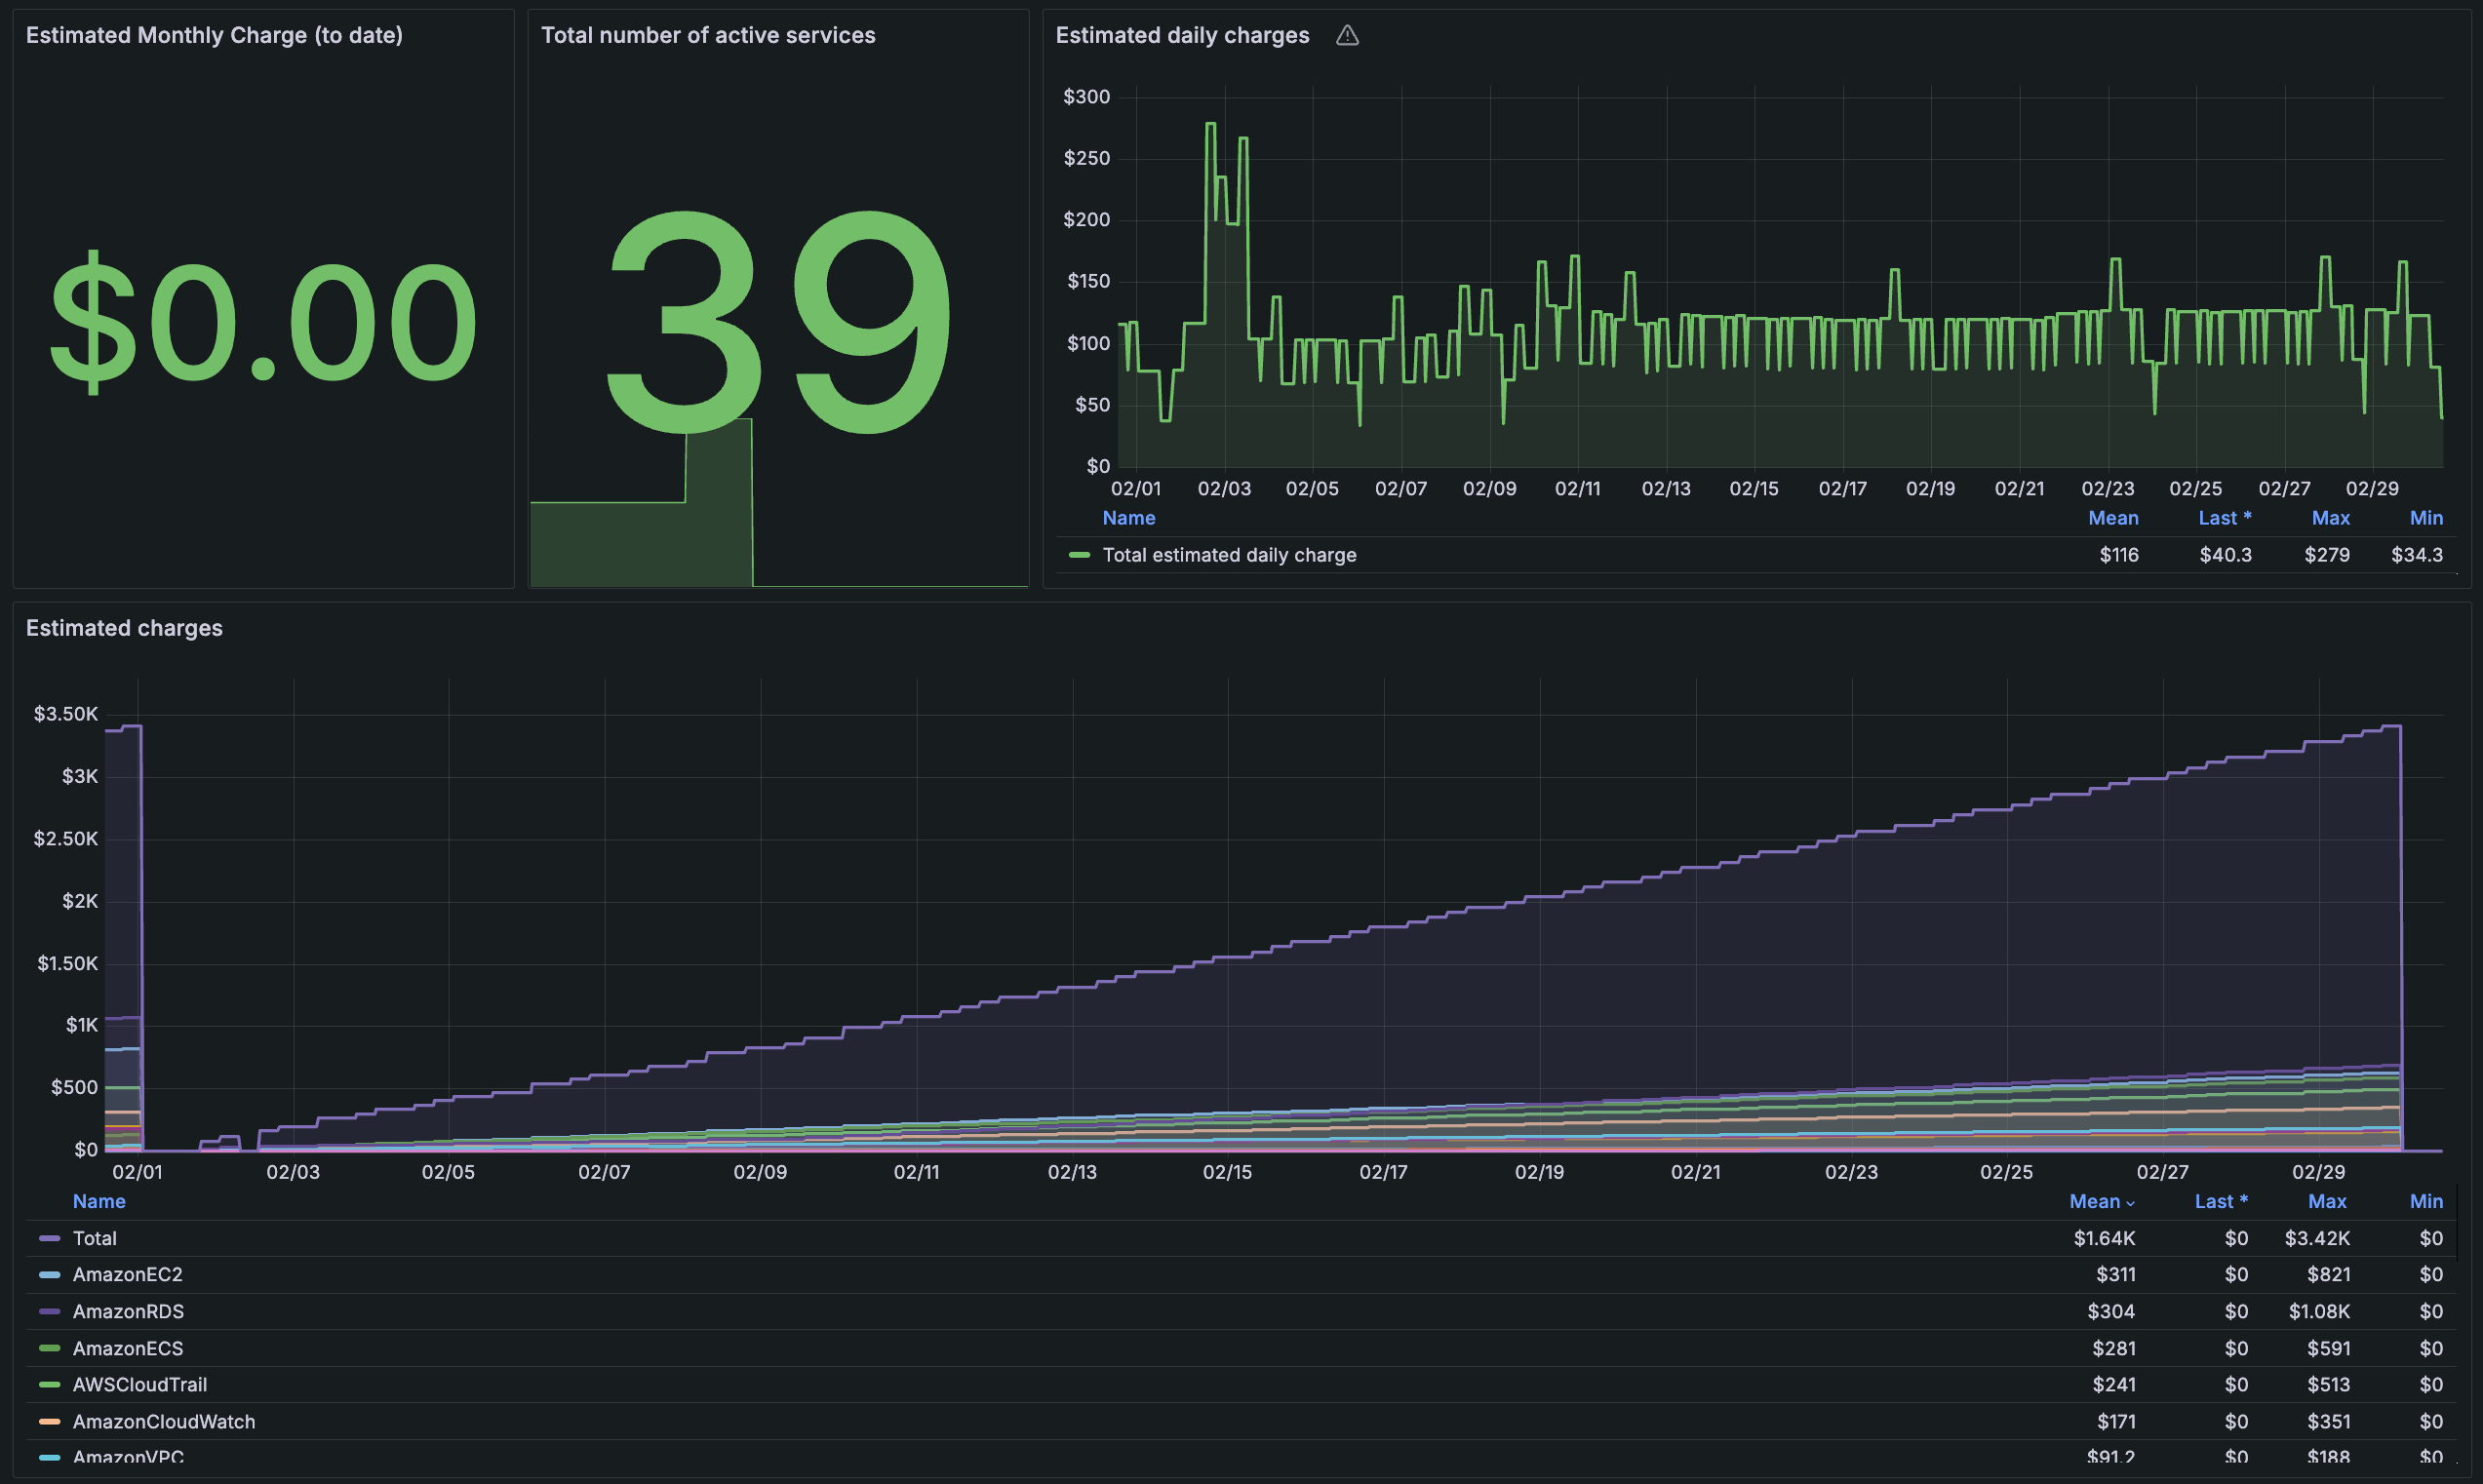
AWS Observability provides preconfigured dashboards embedded within the app.
You can easily access dashboards to monitor AWS costs and cloud services. For example, the following shows the billing dashboard.
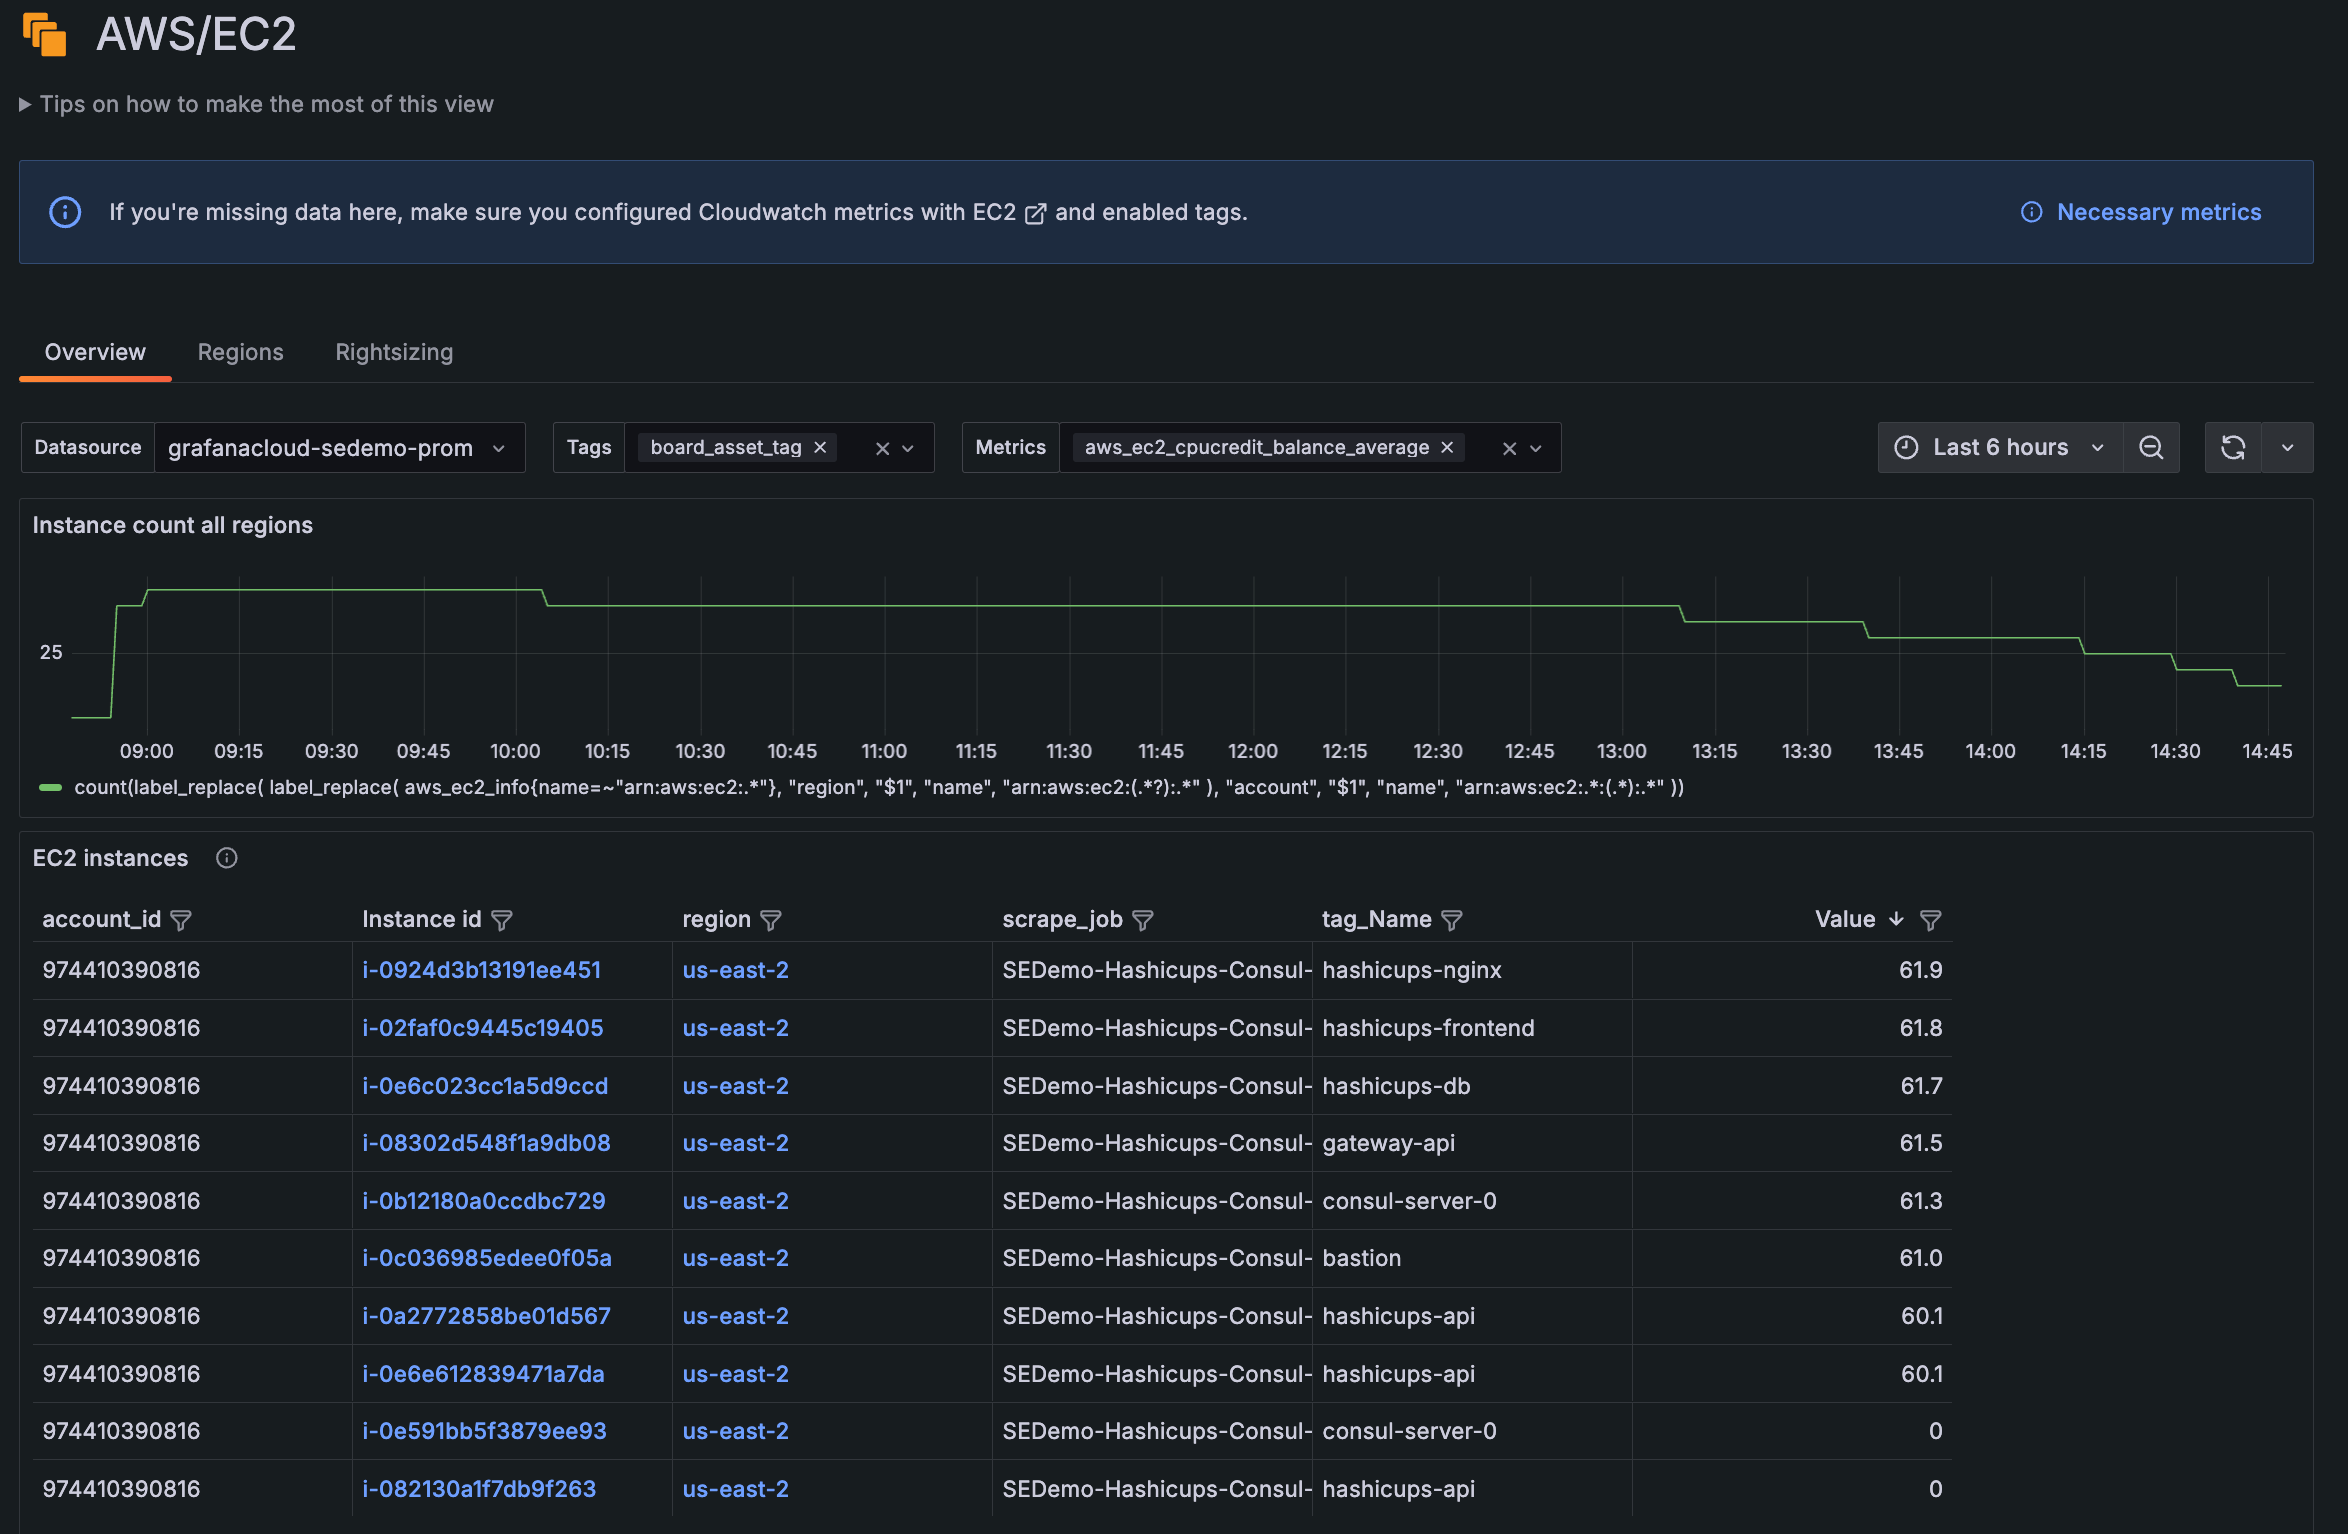
Grafana AWS Observability offers an out-of-the-box, embedded experience for you to efficiently explore and analyze your Amazon EC2 data.
The list of EC2 instances is available from the Overview tab.
You can now create subtables out of your data using the new Group to nested tables transformation. To use this feature, enable the groupToNestedTableTransformation
feature toggle.
We’ve made a number of small improvements to the data visualization experience in Grafana.
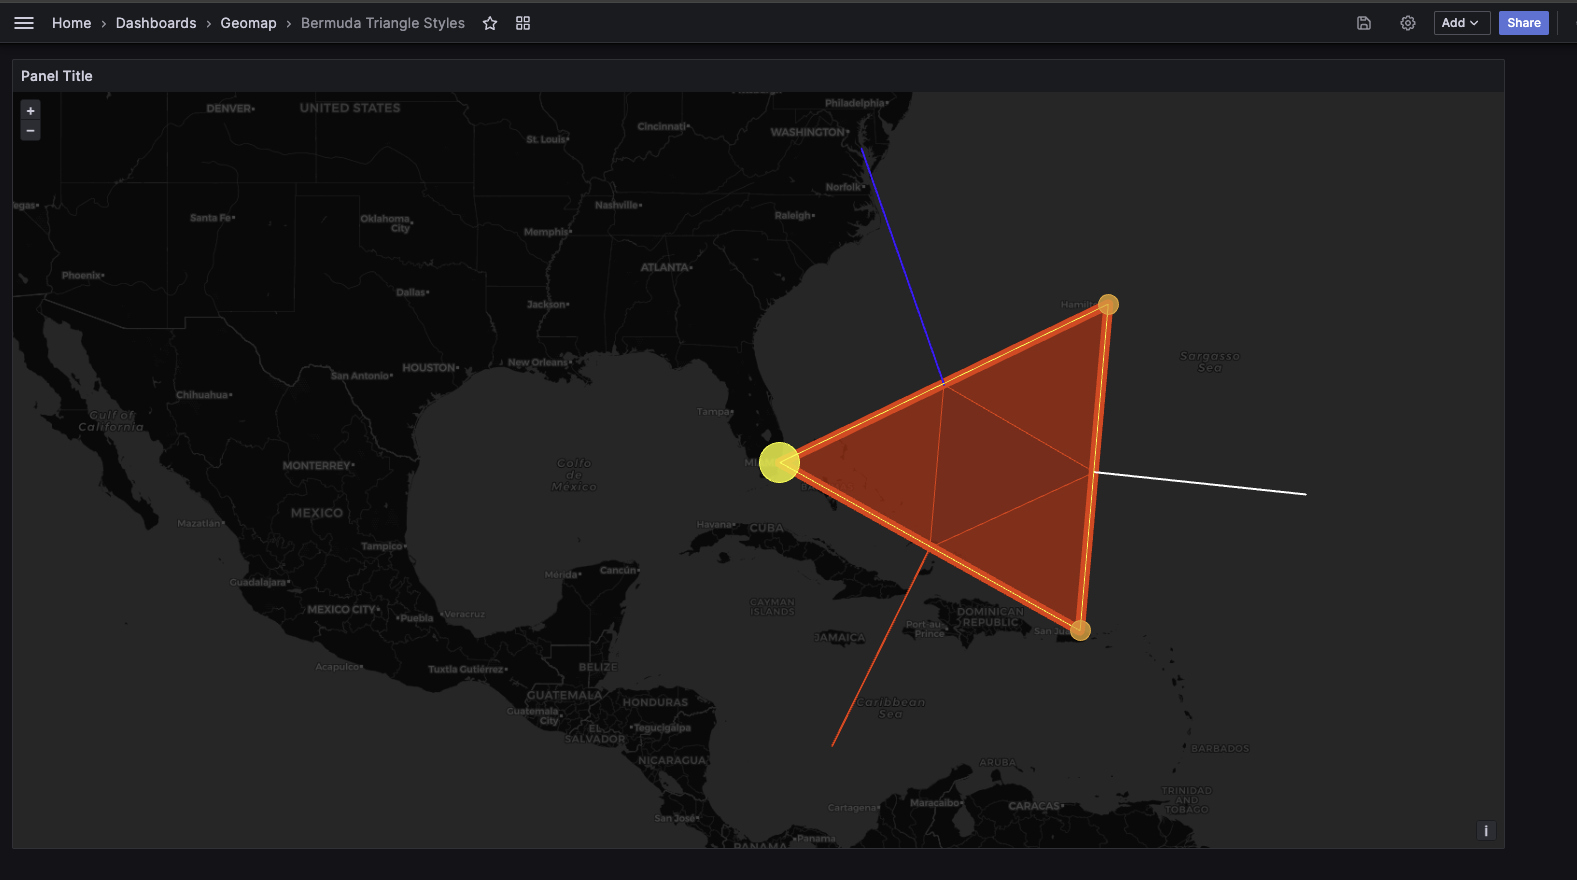
Geomap geojson layer now supports styling
You can now visualize geojson styles such as polygons, point color/size, and line strings. To learn more, refer to the documentation.
We’ve made a number of small improvements to the way tooltips work in Grafana. To try out the new tooltips, enable the newVizTooltips
feature toggle.
Copy on click support
PagerDuty enterprise data source plugin for Grafana allows you to query incidents data or visualize incidents using annotations.
Plugin is currently in a preview phase.

Structured metadata is a feature in Loki and Cloud Logs that allows customers to store metadata that is too high cardinality for log lines, without needing to embed that information in log lines themselves.
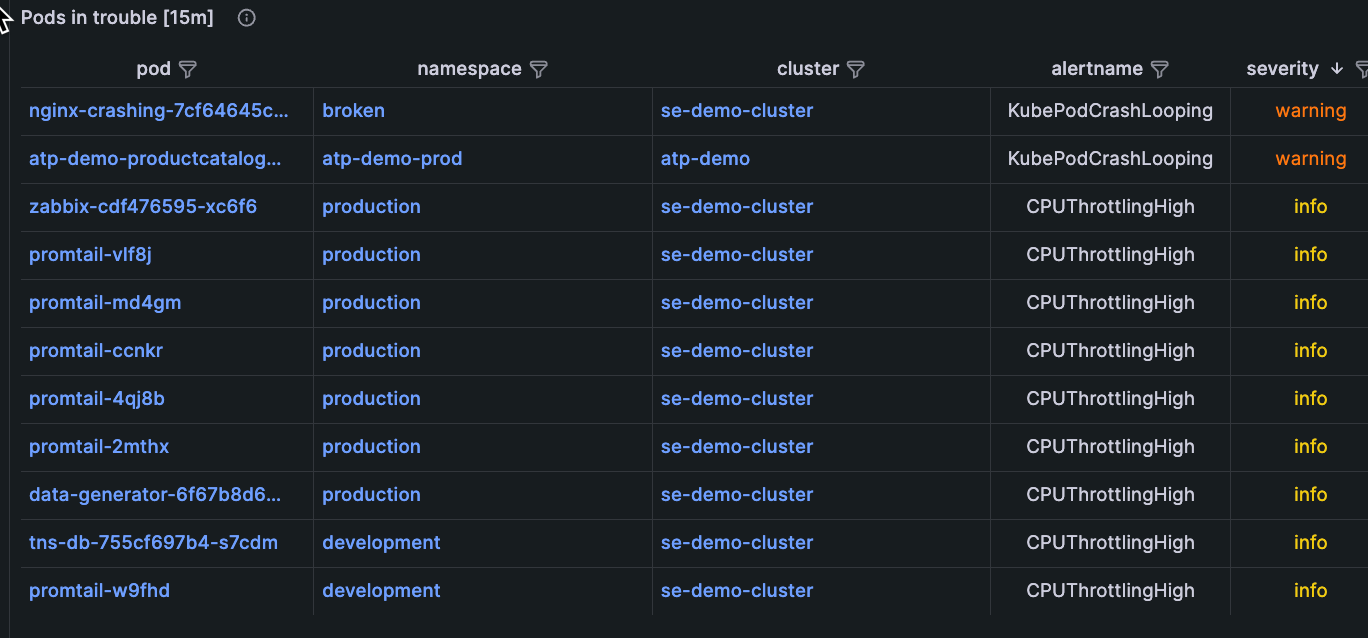
You can respond to and troubleshoot alerts that are firing about your Kubernetes infrastructure and the applications running within it, without leaving the context of Grafana Kubernetes Monitoring. You can start your troubleshooting either through the home page or the Alerts page.
The integration for ClickHouse is available for use with Kubernetes Monitoring.
Release v2.0.0
Explore cost information at any level within your Kubernetes infrastructure. In lists of Clusters, Nodes, namespaces, and workloads, you can switch from a usage view to a cost view to see the cost of each item in the list.