What's new from Grafana Labs
Grafana Labs products, projects, and features can go through multiple release stages before becoming generally available. These stages in the release life cycle can present varying degrees of stability and support. For more information, refer to release life cycle for Grafana Labs.
Loading...
Area of interest:
Cloud availability:
Cloud editions:
Self-managed availability:
Self-managed editions:
No results found. Please adjust your filters or search criteria.
There was an error with your request.
You can use Grafana Cloud k6 cloud options to configure additional test parameters, such as how to distribute your test across load zones, or to use static IP addresses.
By leveraging structured metadata under the hood, Cloud Logs now provides a simplified syntax and better query performance for logs sent through our Cloud OTLP endpoint.
You now have the ability to customize specific colors for individual thresholds when using the Config from query results transformer. Previously, when you added multiple thresholds, they all defaulted to the same color, red. With this addition, you gain the flexibility to assign distinct colors to each threshold.
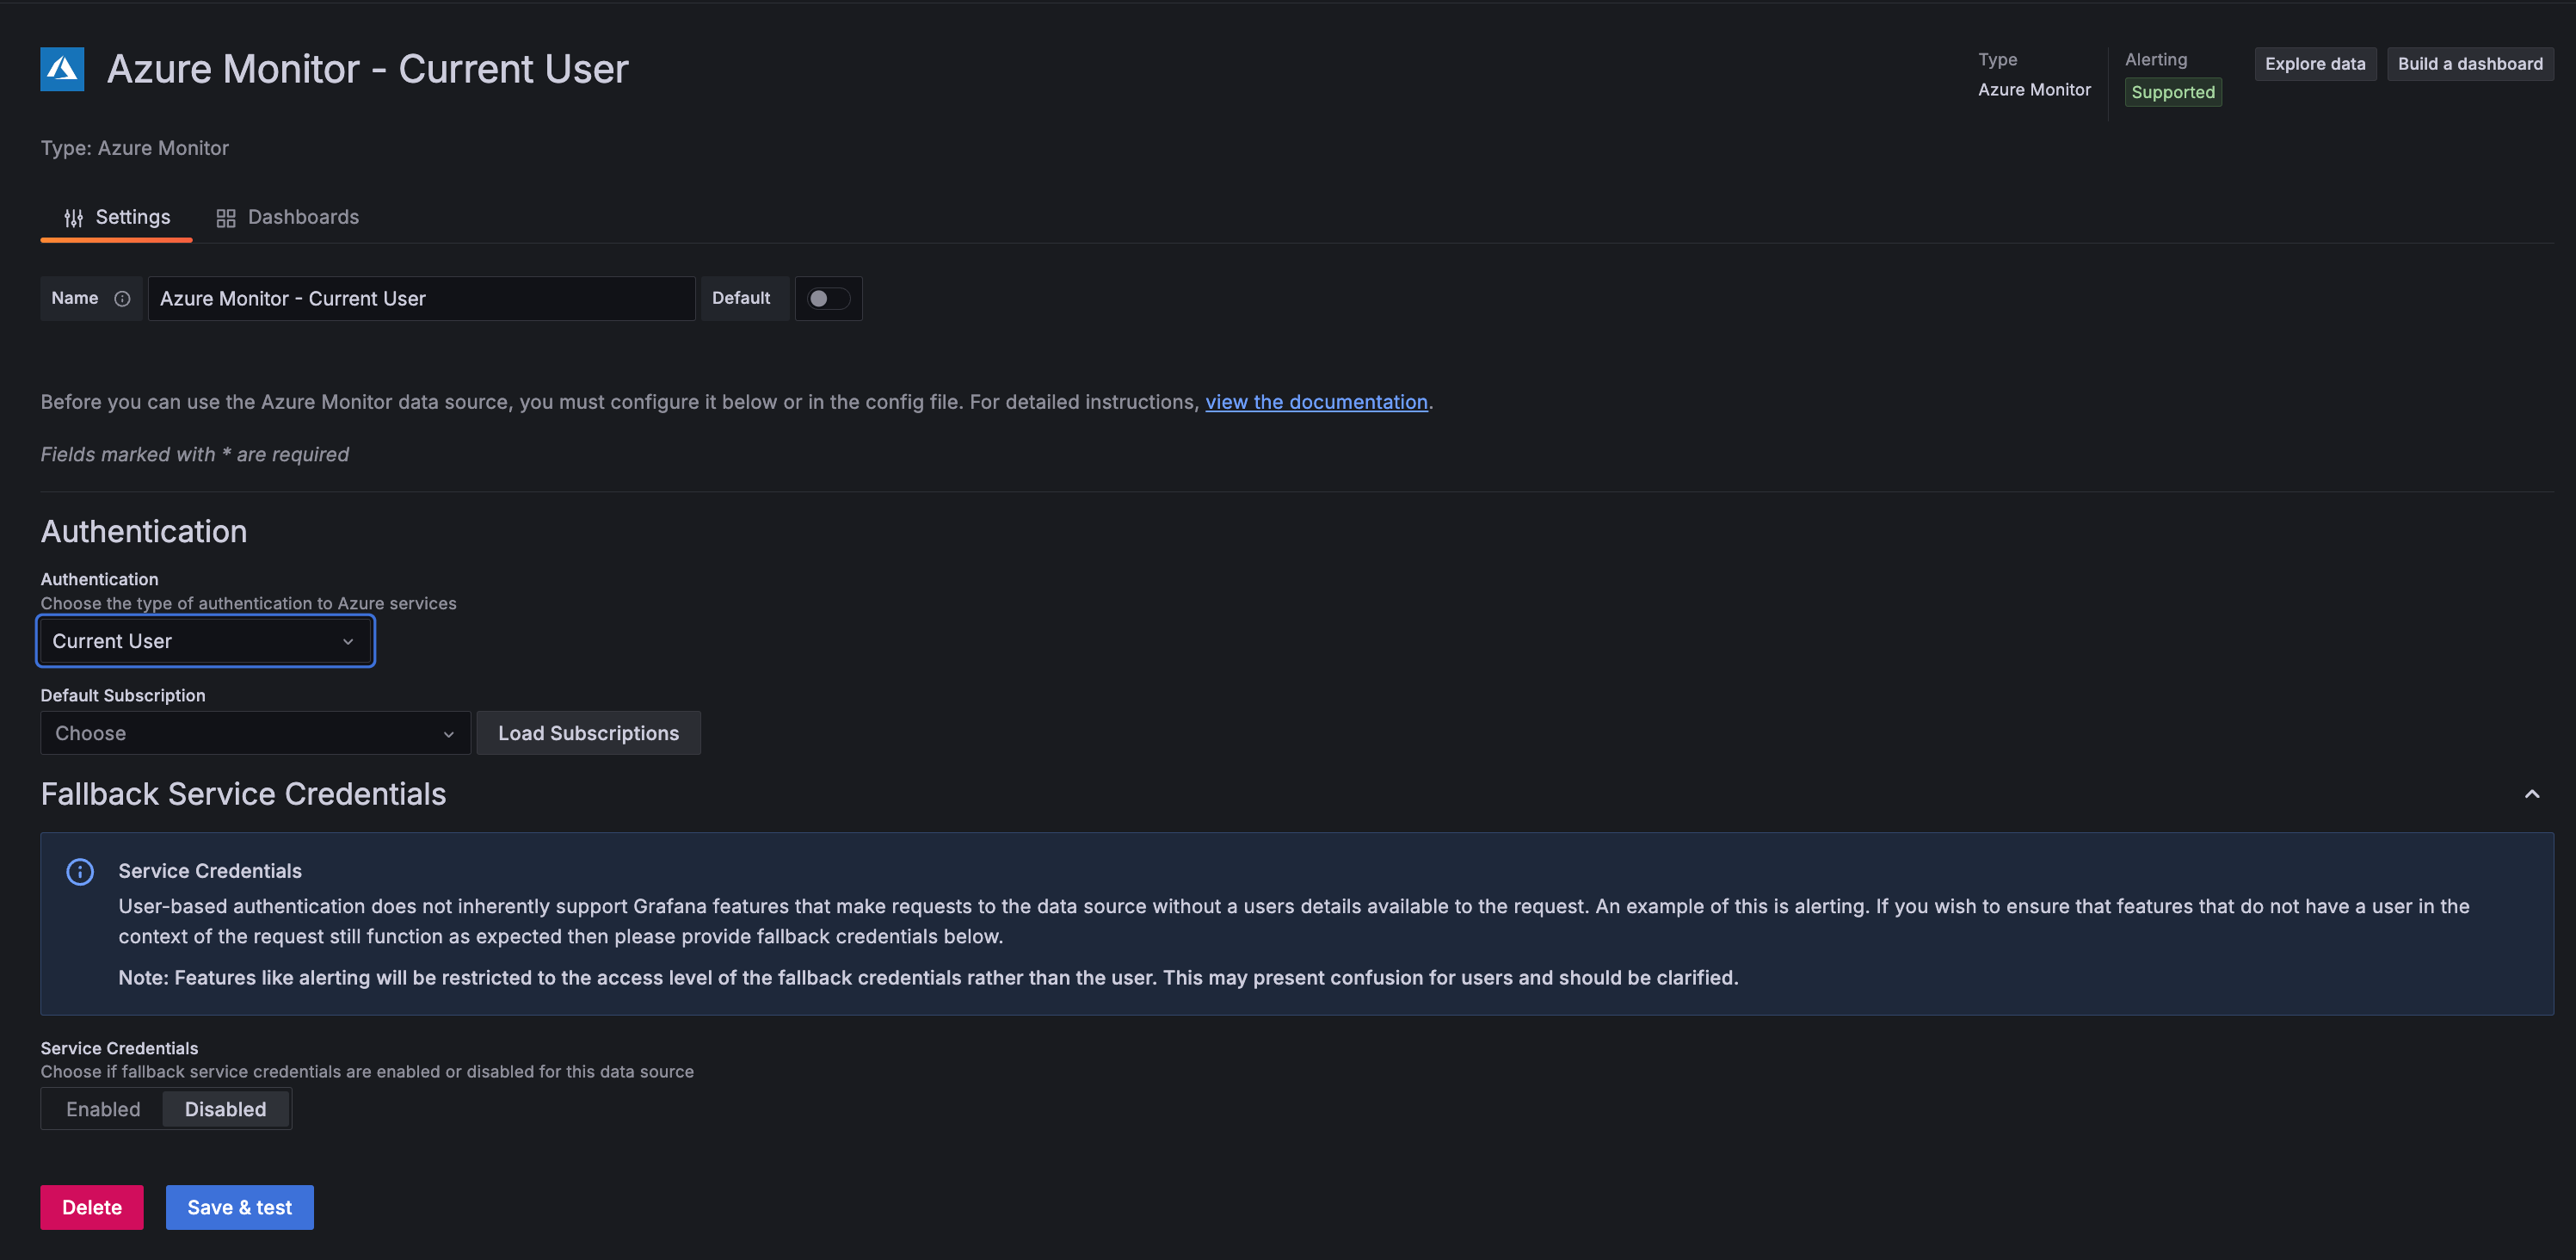
You can now configure the Azure Monitor data source to authenticate as the logged-in Grafana user when making query and resource requests if you also use Azure Entra to sign your users into Grafana.
We’ve made a number of improvements to the canvas visualization.
Enhanced flowcharting functionality
With this release, we’ve updated the canvas visualization to include much-requested flowcharting features. These improvements are:
With the newly added Infinite panning editor option, you can now view and navigate very large canvases. This option is displayed when the Pan and zoom switch is enabled.
The new alert rule detail view has a new look and feel with helpful metadata at the top. The namespace and group are shown in the breadcrumb navigation. This is interactive and can be used to filter rules by namespace or group. The rest of the alert detail content is split up into tabs:

We released generative AI support in both OSS and Cloud last year, supporting features like Incident auto-summary and dashboard creation assistance. One downside was that it was tedious to set up – you had to install & enable the LLM plugin, and separately sign up with OpenAI or Azure to configure your own API keys.
The Grafana plugins catalog contains over 200 data sources, panels and applications to help you make the most of your data. However, finding the right plugin can sometimes be a challenge.
Removal of old Tempo Search tab
In Grafana v10.1, we added a Tempo search editor powered by TraceQL (search tab). We also recommended using this new editor over the older non-TraceQL powered editor.
(Re-)introducing “Keep Last State” to Grafana managed alert rules.
You can now choose to keep the last evaluated state of an alert rule when that rule produces “No Data” or “Error” results. Simply choose the “Keep Last State” option for no data or error handling when editing a rule. Refer to the Alerting documentation on state and health of alert rules for more information.
We are happy to announce Cloud Logs Export is now Generally Available to all Grafana Cloud users!
Cloud Logs Export lets users ship logs to their own object storage (AWS, GCP, Azure) for low-cost, long term retention. If you need to retain logs for long periods of time, without a need to frequently query them, Cloud Logs is the most cost effective way to do that.
Dashboards, when accessed by users with the Viewer role, are now using the Scenes library. Those users shouldn’t see any difference in the dashboards apart from two small changes to the user interface (UI): the variables UI has slightly changed and the time picker is now part of the dashboard container.
Directly from Kubernetes Monitoring, you can click into the Asserts RCA Workbench to see what is occurring between components and their relationships.
 (Release 2.0.4)
You can now use generative AI to assist you in your Grafana dashboards. So far generative AI can help you generate panel and dashboard titles and descriptions - You can now generate a title and description for your panel or dashboard based on the data you’ve added to it. This is useful when you want to quickly visualize your data and don’t want to spend time coming up with a title or description.