
What's new from Grafana Labs
Grafana Labs products, projects, and features can go through multiple release stages before becoming generally available. These stages in the release life cycle can present varying degrees of stability and support. For more information, refer to release life cycle for Grafana Labs.
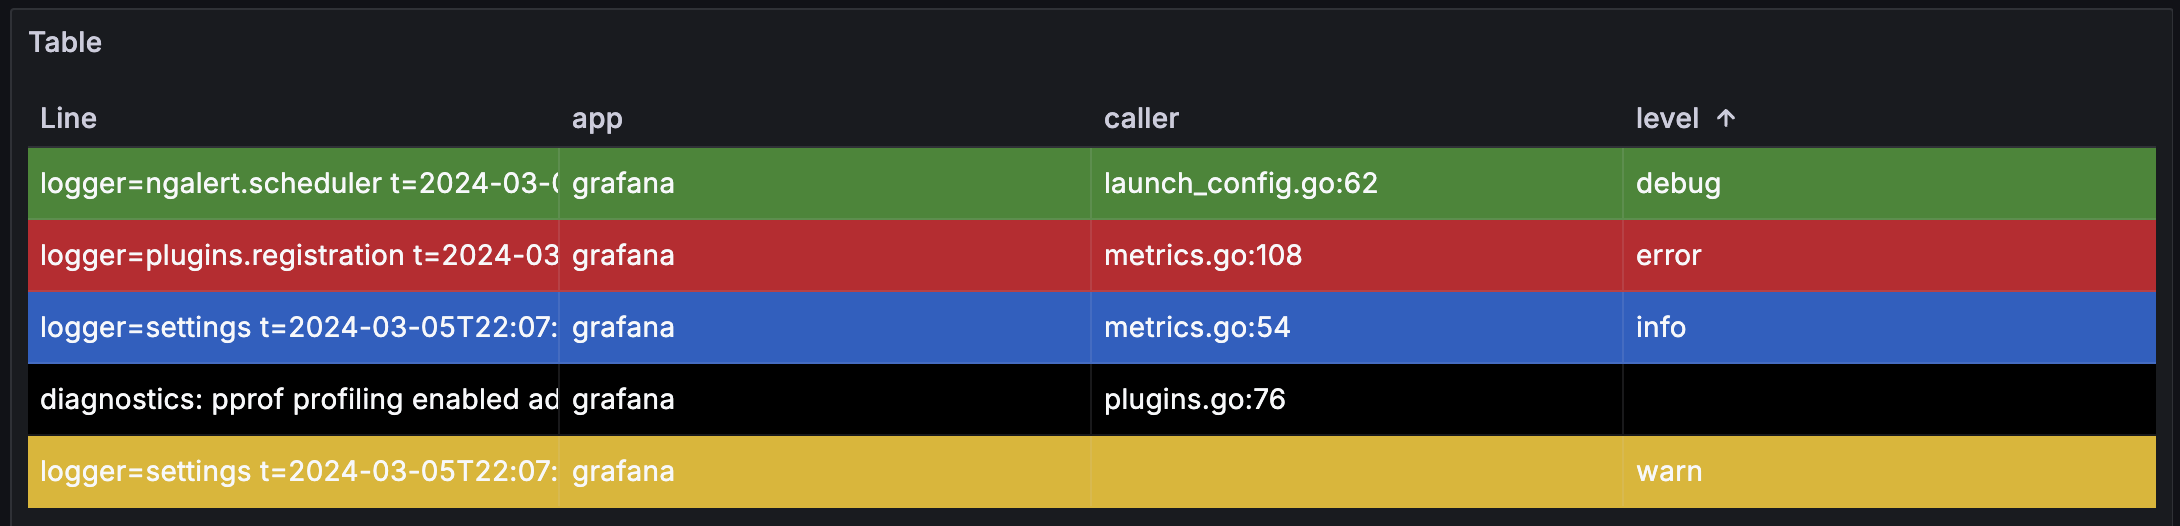
Loading...
Area of interest:
Cloud availability:
Cloud editions:
Self-managed availability:
Self-managed editions:
No results found. Please adjust your filters or search criteria.
There was an error with your request.
We are announcing a license change to the anonymous access feature in Grafana 11. As you may already be aware, anonymous access allows users access to Grafana without login credentials. Anonymous access was an early feature of Grafana to share dashboards; however, we recently introduced Public Dashboards which allows you to share dashboards in a more secure manner. We also noticed that anonymous access inadvertently resulted in user licensing issues. After careful consideration, we have decided to charge for the continued use of anonymous access starting in Grafana 11.
We’re excited to announce a big update to our Synthetic Monitoring product!
Until now, Synthetic Monitoring has used the Prometheus blackbox exporter to test at the protocol level: HTTP, DNS, TCP, gRPC, and ICMP (for ping and traceroute). This worked well for health and uptime monitoring, but it didn’t cover the full range of synthetic monitoring use cases. With modern applications, it’s important to test not only single endpoints but also complex transactions and critical user journeys.
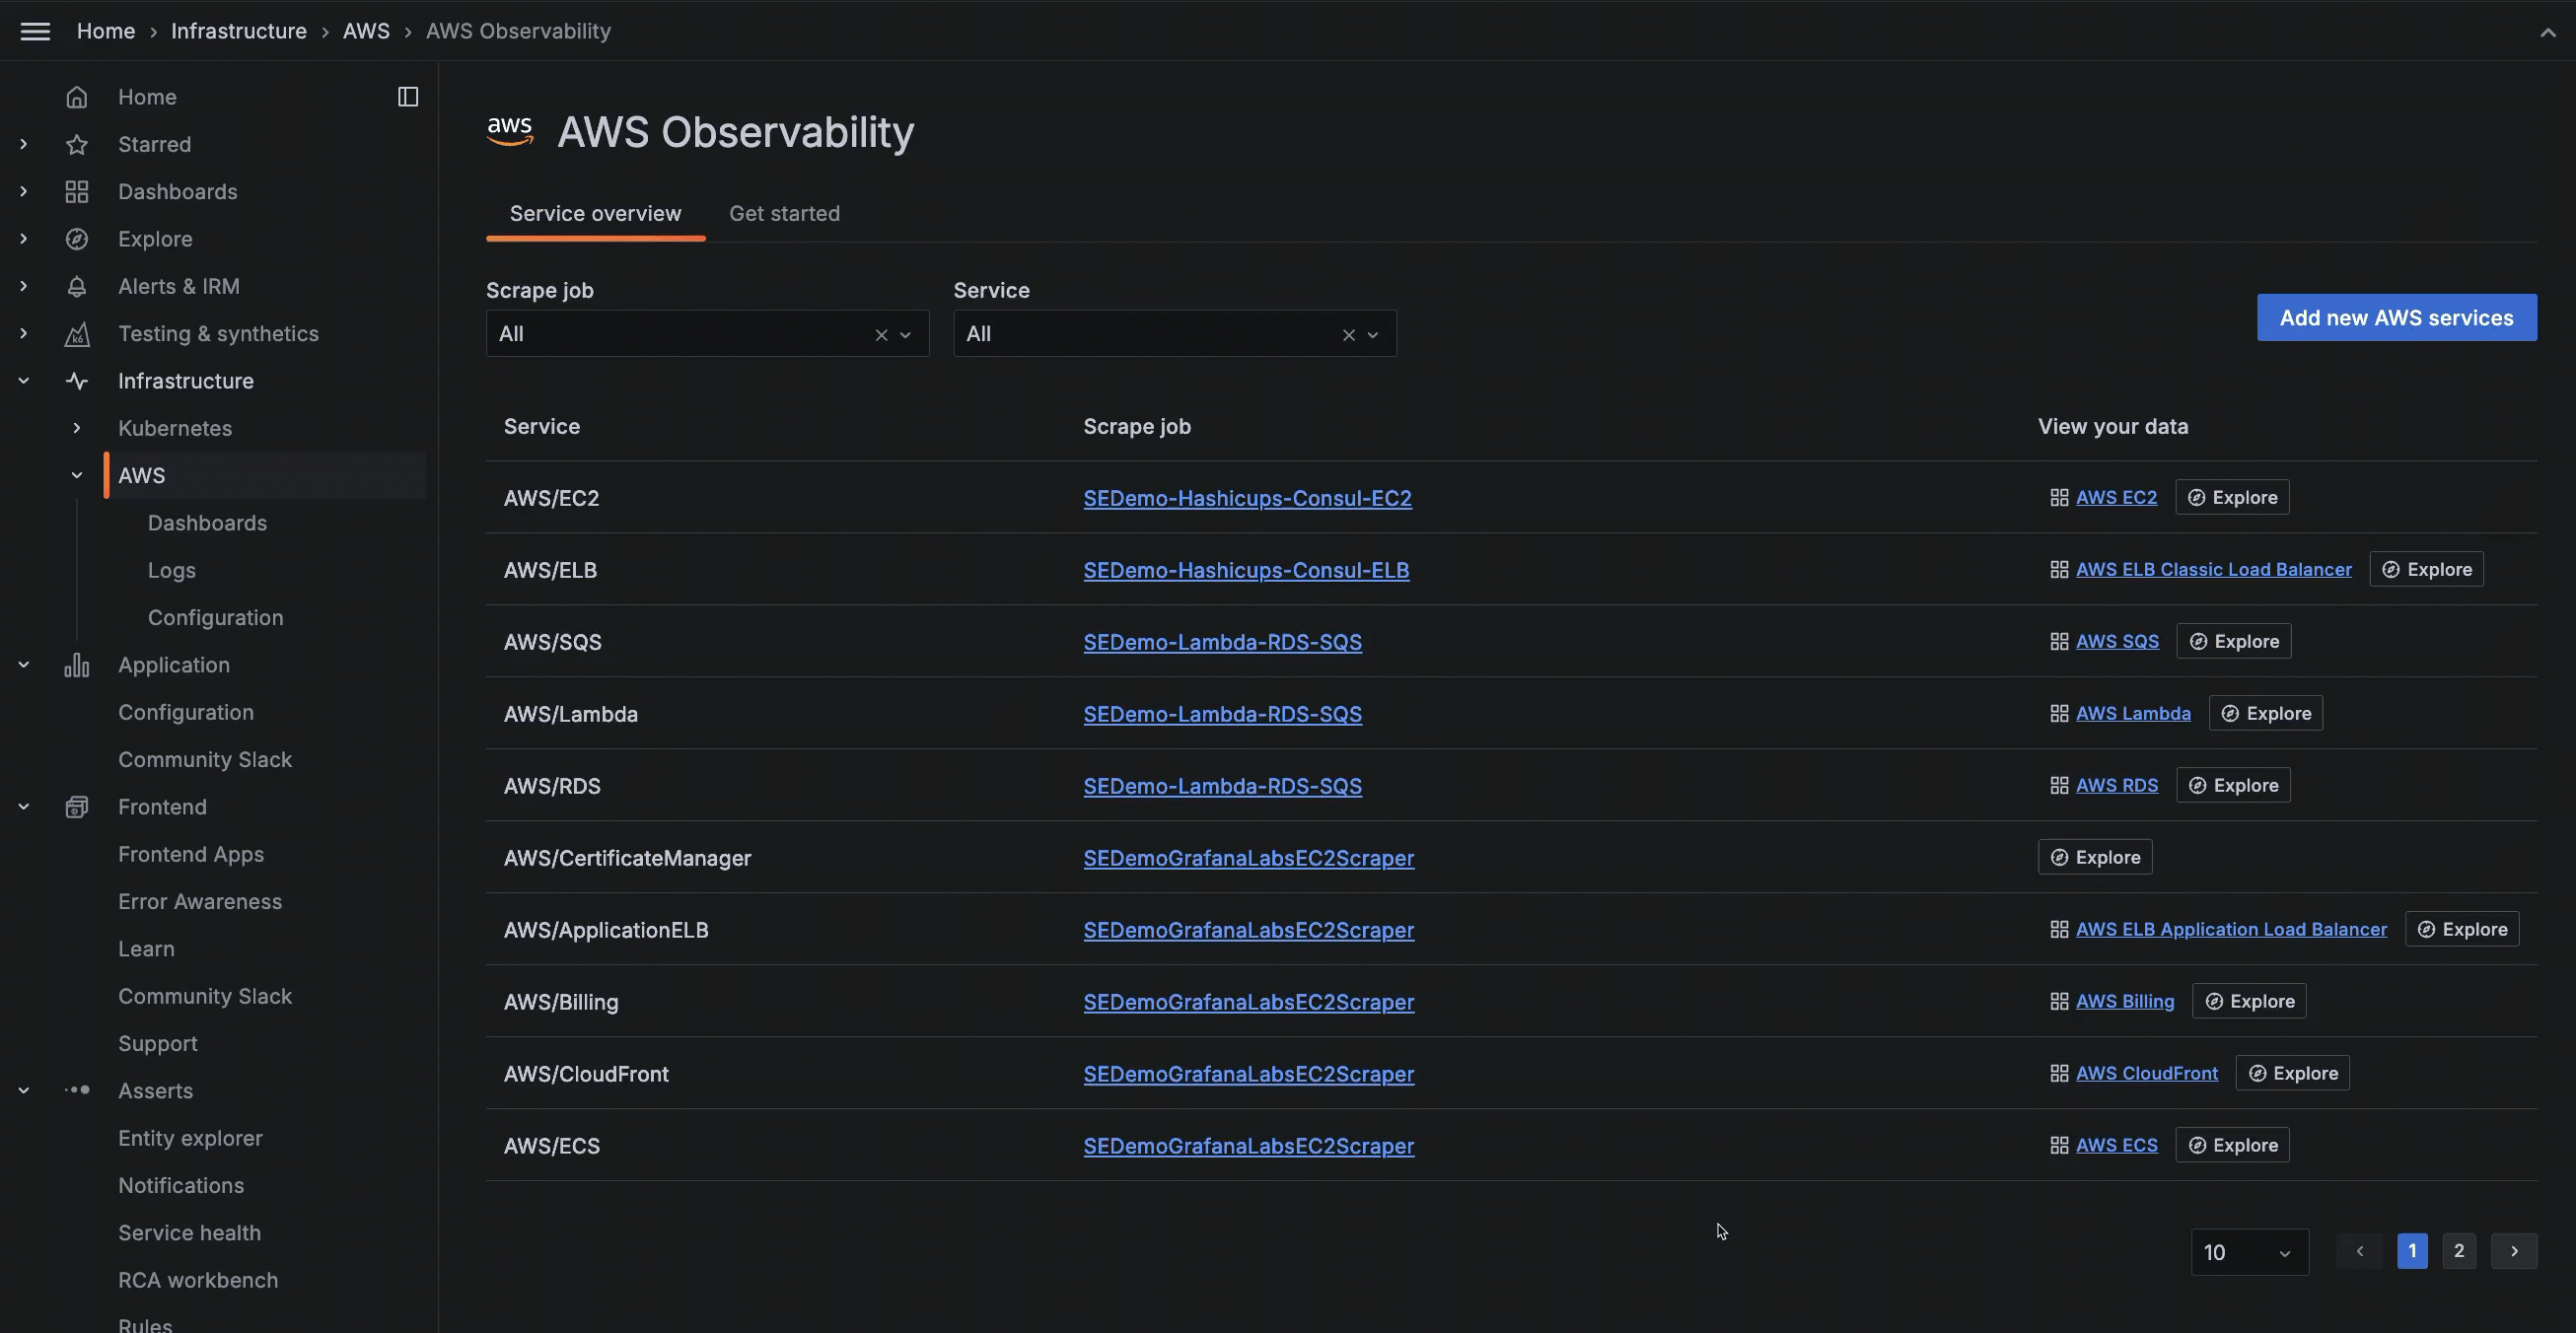
In the RDS dashboard, monitor your RDS instances within AWS Observability, and troubleshoot common issues like CPU and memory provisioning.
Filter by Pod type on the Workloads list page to find static Pods and bare/unmanaged Pods.

Control the automatic refresh interval of the GUI as well as disable the auto refresh until you are ready to do so manually. This is particularly useful for very large Kubernetes fleets that display a lot of data.

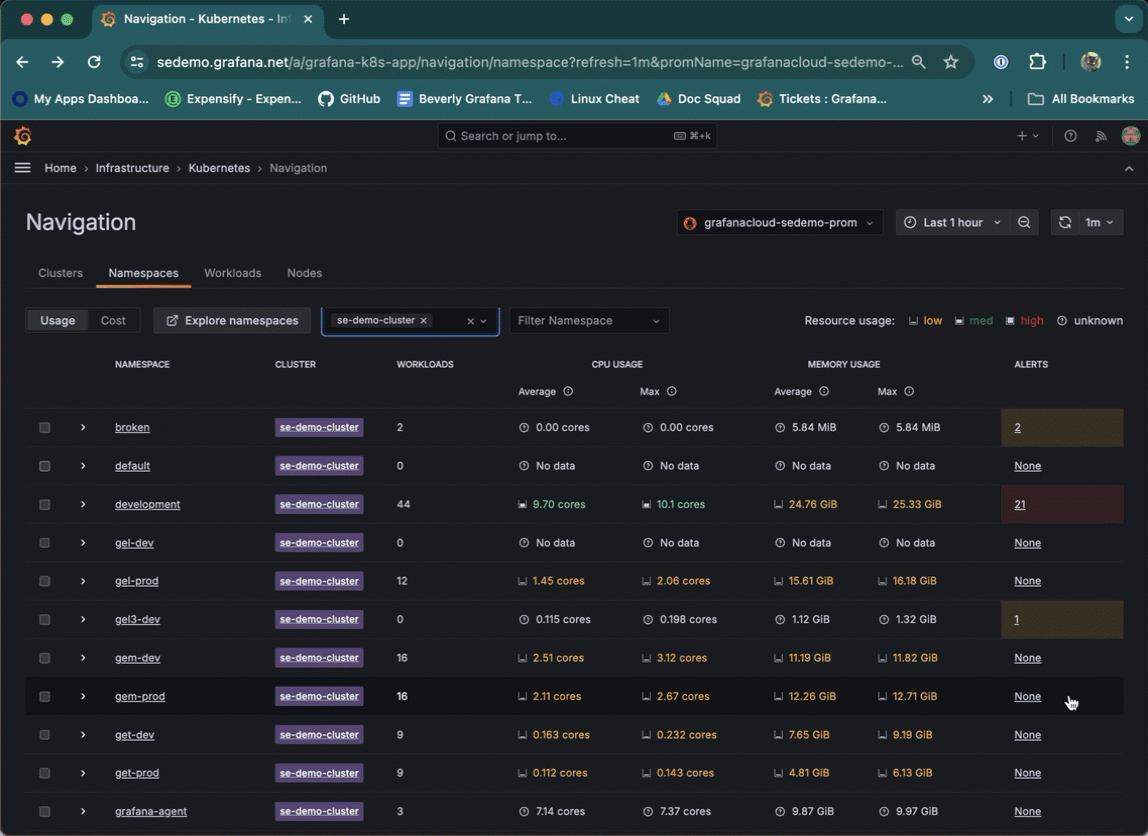
Navigate to the Alert rules page from a list item on a Cluster, namespace, Node, Pod, or container list. To do so, click the underlined alert number for next to the list item.
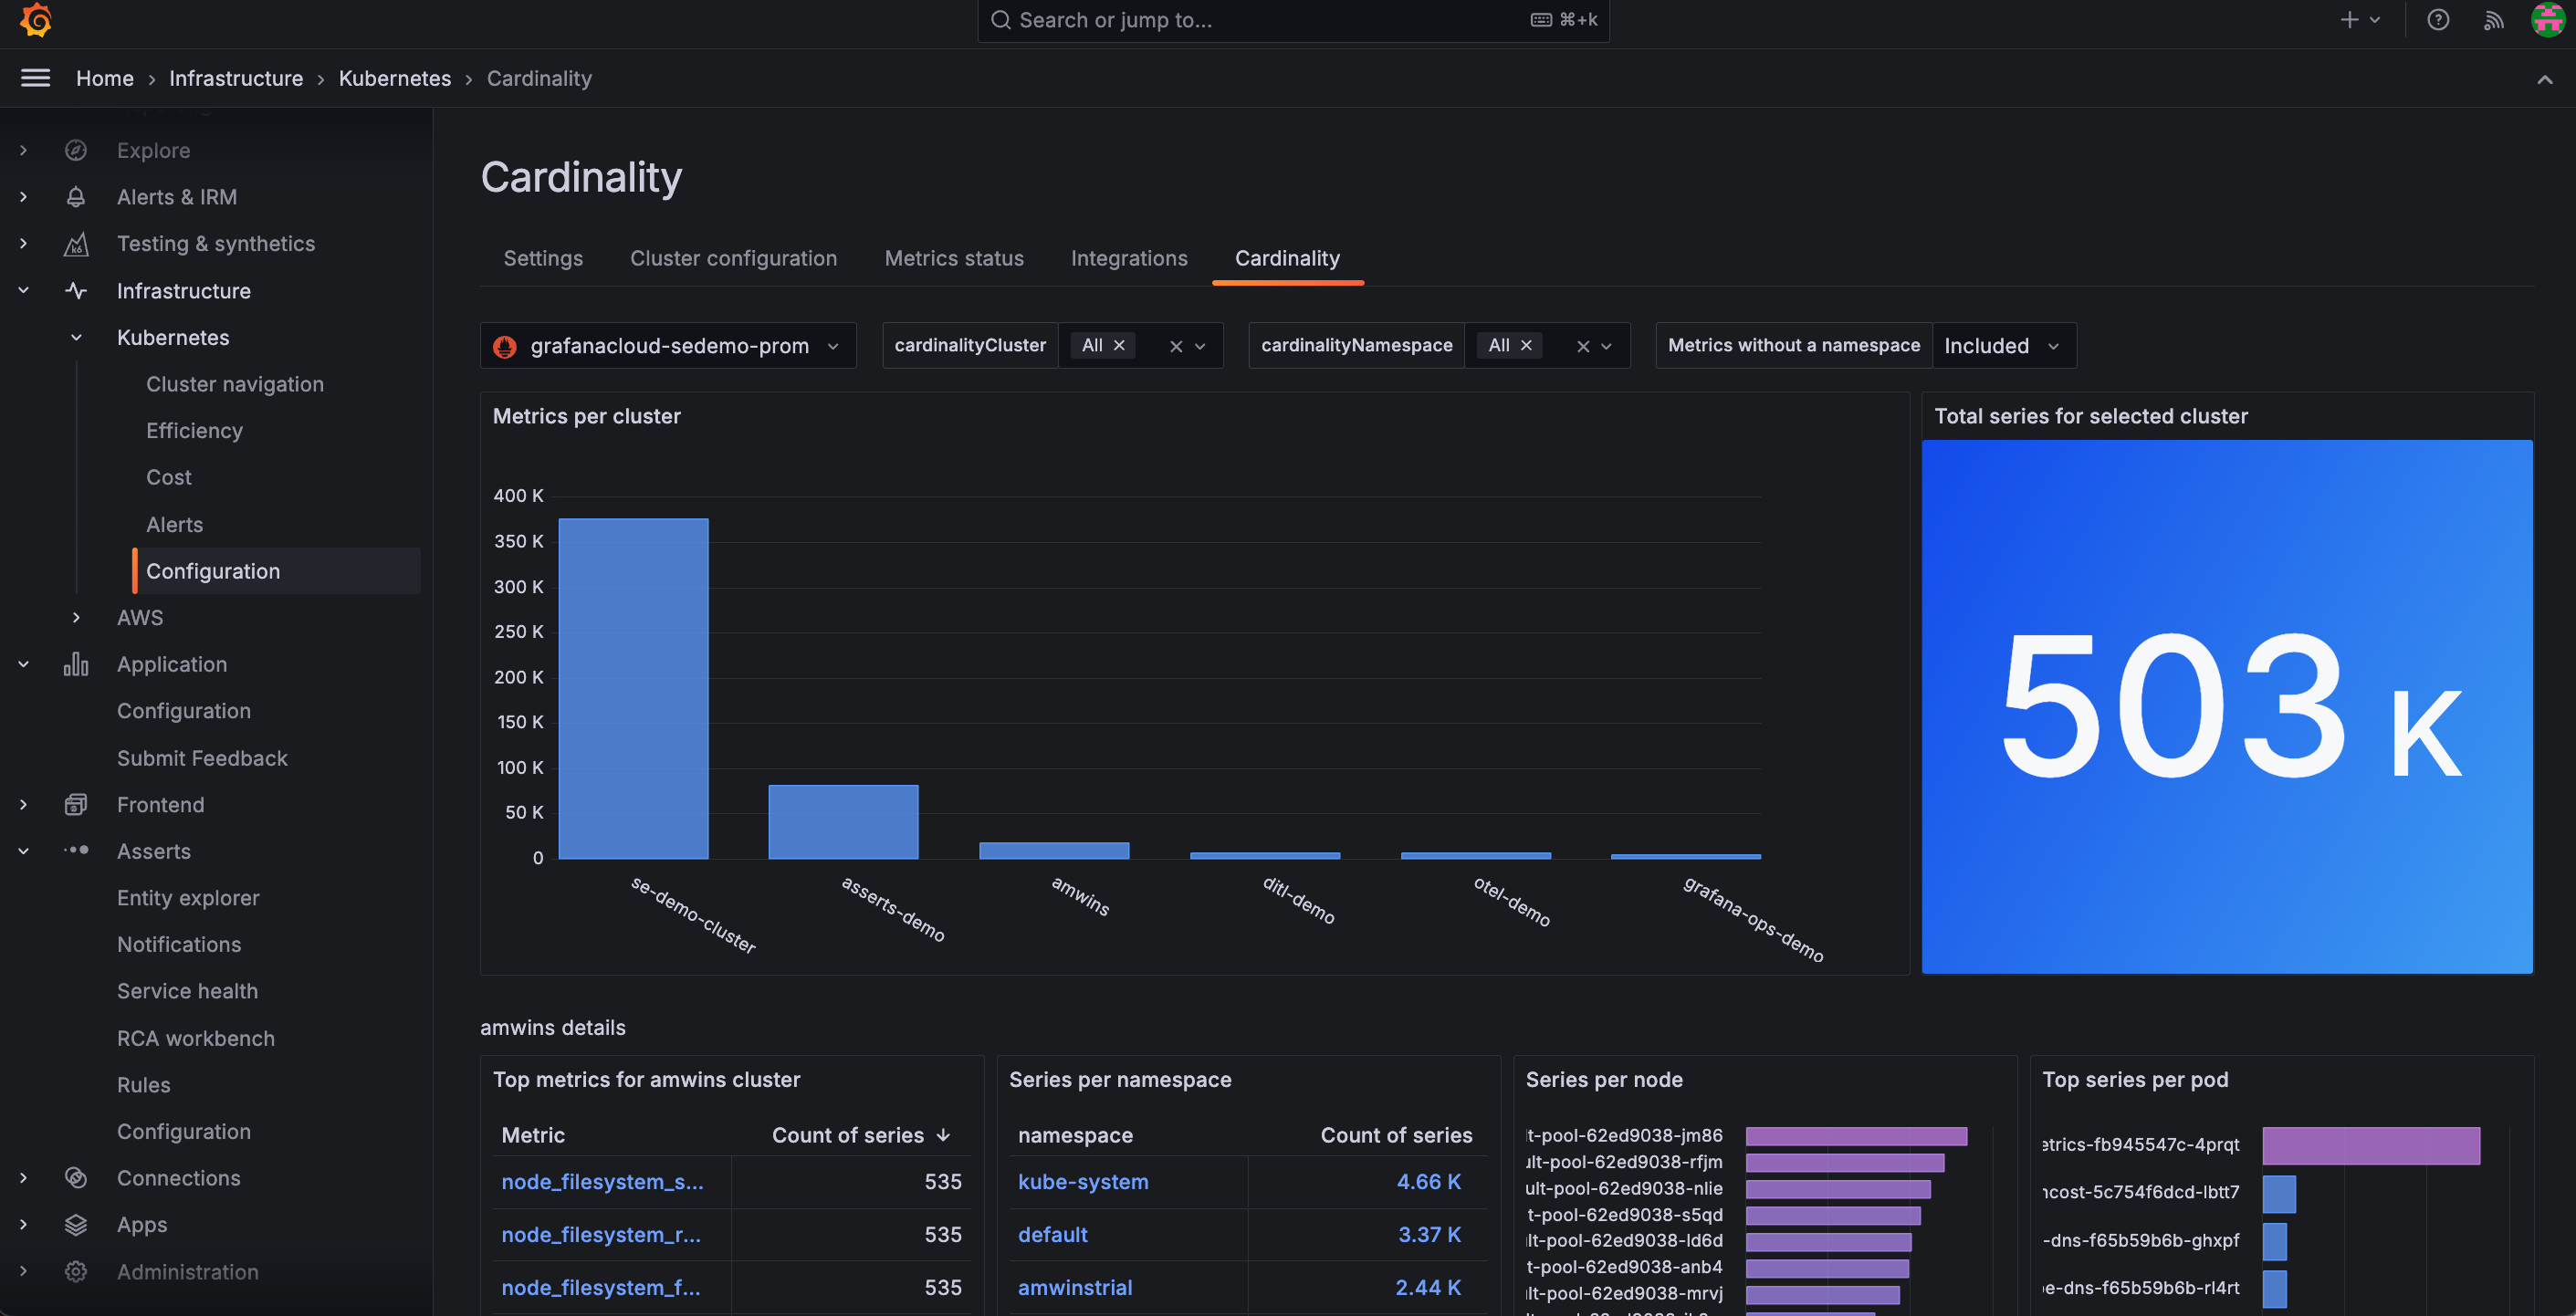
Use the in-app Cardinality page to discover on a Cluster-by-Cluster basis where all your active series are coming from for:
- Troubleshooting after initial configuration
- Determining potential duplicate metrics
- Finding other potential cardinality issues
Explore Metrics is a query-less experience for browsing Prometheus-compatible metrics. Search for or filter to find a metric. Quickly find related metrics - all in just a few clicks. You do not need to learn PromQL! With Explore Metrics, you can:
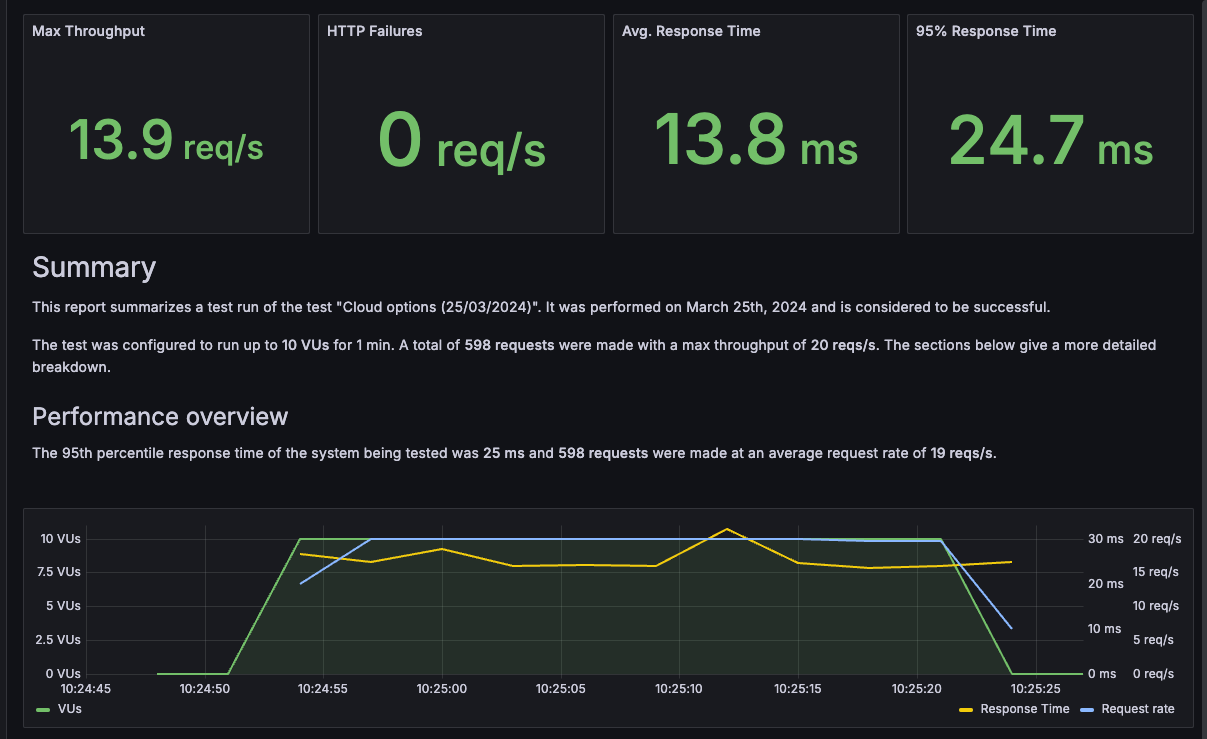
After you run a performance test in Grafana Cloud k6, the next step is to analyze the results and share any findings with your team. Sometimes, you don’t need your team members to view all the resulting metrics, or you might want to generate a PDF in an accessible, easy-to-read format to share with external stakeholders.
Grafana 11 adds the ability to color full table rows using the Colored background cell type of the table visualization. When you configure fields in a table to use this cell type, an option to apply the color of the cell to the entire row becomes available.
Grafana Synthetics now supports longer durations for two options:
Timeout -> Increased maximum to 60 seconds.
Frequency -> Increased maximum to 60 minutes.
Plugin developers and users typically want their plugins to be compatible with a range of Grafana versions. However, ensuring this is true can be a challenge. The environment, APIs, and UI components may differ from one version to another. Manual testing is tedious and error-prone. End-to-End testing across multiple versions is prohibitively complicated given the version-to-version changes in Grafana itself - until now.
The Alerting Provisioning HTTP API has been updated to enforce Role-Based Access Control (RBAC).
- For Grafana OSS, users with the Editor role can now use the API.
- For Grafana Enterprise and Grafana Cloud, users with the role Rules Writer and Set Provisioning status can access the API and limit access to alert rules that use a particular data source.
- Other roles related to provisioning, for example Access to alert rules provisioning API still work.
From a Pod, Cluster, namespace, or workload view, you can begin an incident investigation by clicking Run Sift investigation.

Pause and resume alert rule evaluation directly from the Alert rules list and details view. This helps Improve visibility of when alert rules have been paused by displaying “Paused” as the alert rule state.