
What's new from Grafana Labs
Grafana Labs products, projects, and features can go through multiple release stages before becoming generally available. These stages in the release life cycle can present varying degrees of stability and support. For more information, refer to release life cycle for Grafana Labs.
Loading...
Area of interest:
Cloud availability:
Cloud editions:
Self-managed availability:
Self-managed editions:
No results found. Please adjust your filters or search criteria.
There was an error with your request.
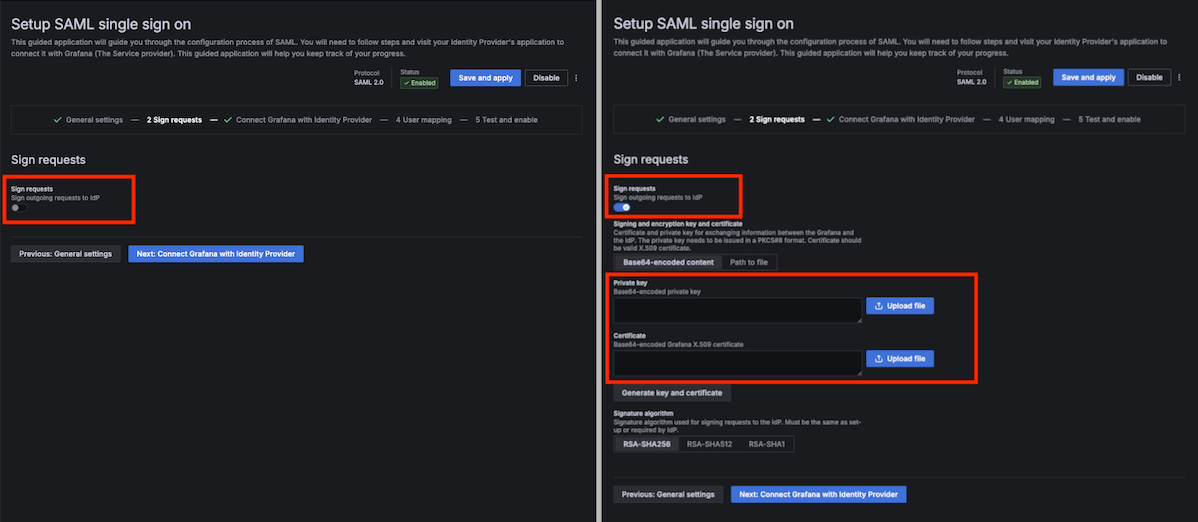
The private key and certificate fields are no longer mandatory in the SAML form. To configure SAML without providing a private key and a certificate you have to opt out from using signed requests.
We’ll be improving the scalability, reliability, and functionality of 6 synthetic monitoring probe locations by moving them to AWS: Frankfurt, Singapore, London, Mumbai, Sydney, and Tokyo. This change will bring static IPv4 addresses and IPv6 CIDR ranges for more reliable allow-listing, as well as make k6-powered scripted checks available in these locations. The locations will be upgraded to a new public probe architecture with improved reliability.
We’ve streamlined the onboarding process for OnCall, making it quicker and easier for new users to get started.
Now, new users can access OnCall immediately without waiting for an admin to log in. OnCall initialization has been moved to the backend, reducing setup time and minimizing potential errors. Additionally, user synchronization between Grafana and OnCall is significantly faster, so newly created users can start using OnCall within minutes—without any delays or extra steps.
Webhooks are a useful and flexible way to interact with third-party services. While OnCall has supported advanced webhook integrations for some time, they were previously limited to automatic triggers, such as event-based triggers (e.g., alert group status changes) or escalation chain steps.

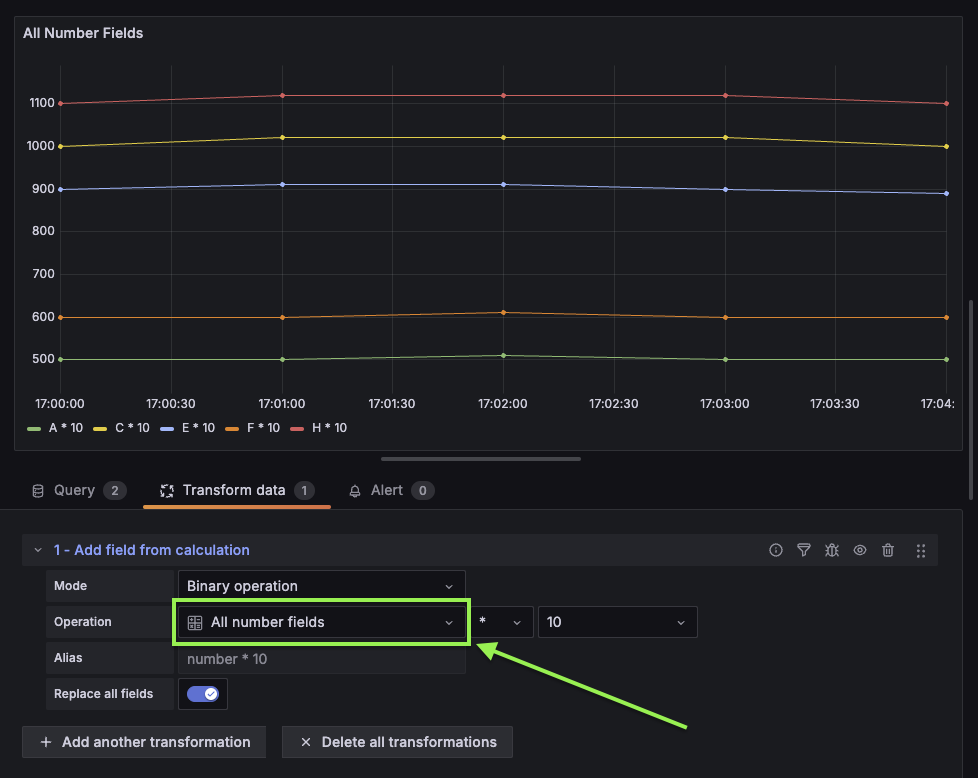
We’ve made a helpful update to the Binary operation mode of the Add field from calculation transformation!
When you set up a binary operation calculation, there’s a new All number fields option available to select. Use this to apply a mathematical operator to multiple number fields simultaneously. This feature is particularly useful when you’re scaling or offsetting data containing multiple, dynamically named fields, allowing the transformation to be applied when dealing with unknown field names.
Jumpstart your alert creation and customization. Throughout Kubernetes Monitoring, panels from CPU usage to cost are ready for you to create and customize an alert.
Grafana admins struggle to effectively communicate important updates and maintenance information to their users through traditional channels like email and Slack. Customers have requested a feature to display customizable banners within the Grafana interface to ensure critical information is visible and timely.

Introducing the new mobile app home screen
The new home screen is a centralized hub that gives you an at-a-glance overview of everything you need as soon as you open the app. Whether you’re checking your on-call schedule, monitoring active incidents, or managing alert groups, everything is now front and center, making the app more streamlined and efficient for your daily use.

You can now create subfolders in folders where you have Edit or Admin rights without needing any additional permissions. This enables users and teams to fully manage their folder and dashboard hierarchy, and allows you to keep your instance secure by granting users the minimum necessary set of permissions.
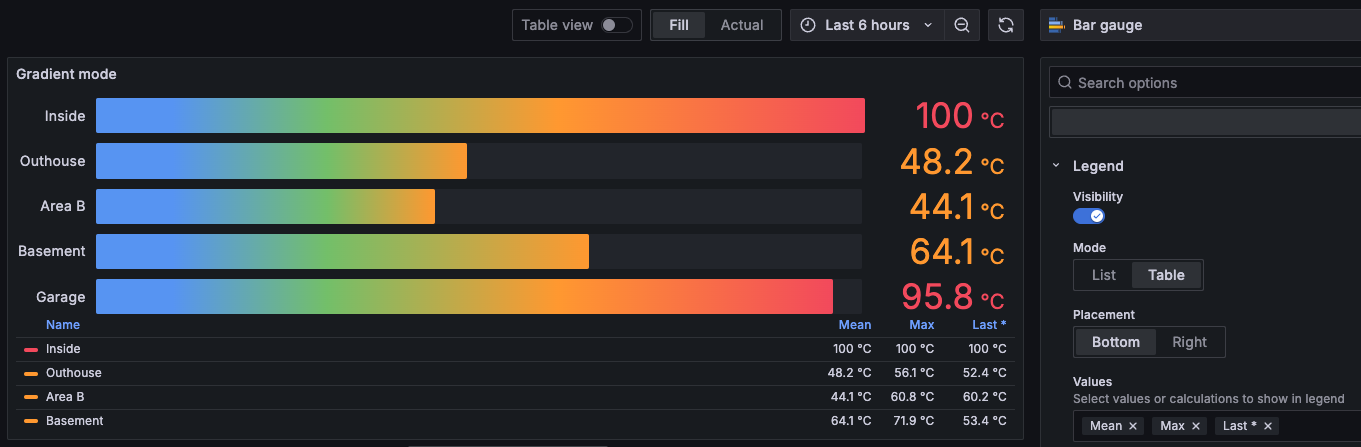
We’ve added legend support to bar gauge visualizations. You can customize legends by navigating to the Legend section in panel options. By default, the legend is disabled.
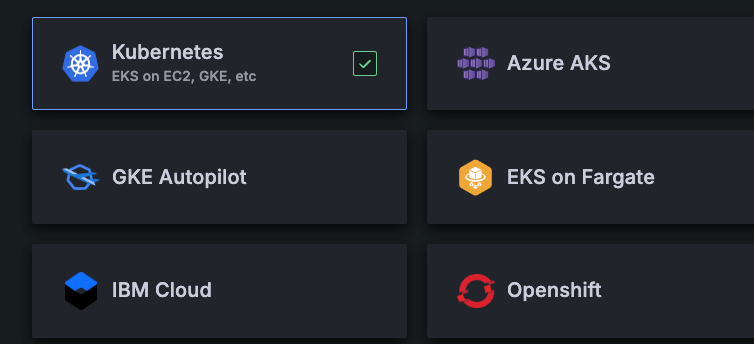
You can now choose Azure AKS as a platform when using the easy deploy method with the Kubernetes Monitoring Helm chart. This sets the required annotations in the Helm chart config file.
Public Preview in Grafana OSS and Grafana Enterprise
Migrating from OSS or Enterprise Grafana to Grafana Cloud has traditionally been complex, requiring technical knowledge of Grafana’s HTTP API and time-consuming manual processes. The new Grafana Cloud Migration Assistant changes this by providing a user-friendly interface that automates the migration of your resources. No coding required, it securely handles the transfer in just a few easy steps.
When setting up Grafana with Azure AD using the SAML protocol, the Azure AD Graph API sometimes returns a follow-up Graph API call rather than the information itself. This is the case for users who belong to more than 150 groups when using SAML.
We’ve updated canvas visualizations so that now you can add actions to canvas elements. The Selected element configuration now includes a Data links and actions section where you can add actions to elements. Each action can be configured to call an API endpoint.
As Grafana keeps growing, we have had feedback that it can be hard to find the pages you are looking for in the navigation. That is why we have added a new section to the navigation called ‘Bookmarks’, so you can easily access all of your favourite pages at the top of the navigation.
