What's new from Grafana Labs
Grafana Labs products, projects, and features can go through multiple release stages before becoming generally available. These stages in the release life cycle can present varying degrees of stability and support. For more information, refer to release life cycle for Grafana Labs.
Loading...
Area of interest:
Cloud availability:
Cloud editions:
Self-managed availability:
Self-managed editions:
No results found. Please adjust your filters or search criteria.
There was an error with your request.
We’ve renamed the Public dashboards feature, Shared dashboards. This renaming is part of our overall redesign of dashboard sharing and aims to better align externally shared dashboards with other dashboard sharing options.
The OpenID Connect Discovery URL is available in the Generic OAuth form. The info extracted from this URL will be used to populate the Auth URL, Token URL and API URL fields.
You can generate a new certificate and private key for SAML directly from the UI form. Click on the Generate key and certificate button from the Sign requests tab in the SAML form and then fill in the information you want to be embedded in your generated certificate.
Explore Logs offers a queryless experience for easily surfacing insights from logs stored in Grafana Loki, Grafana Cloud Logs, and Grafana Enterprise Logs.
You can spot troublesome services without running a single query, and quickly add filters with point-and-click interactions. Explore Logs generates visualizations of log volumes to let you easily detect anomalies or related changes across labels and over time. Patterns help you identify sources of signal or filter our sources of noise in your log line content, further accelerating your troubleshooting process.
Explore Metrics, generally available in Grafana OSS, Grafana Enterprise, and Grafana Cloud, offers a queryless experience to visualize time series data stored in Prometheus or any Prometheus-compatible time-series database.
Explore Profiles offers a queryless experience for easily surfacing insights from profiles stored in Grafana Pyroscope and Grafana Cloud Profiles.
Profiling data helps developers identify which parts of a program consume the most resources, such as CPU time, memory, or I/O operations. Profiling, as a signal, lets you either proactively or reactively address performance issues in multiple areas areas.
Explore Traces offers a queryless experience for easily surfacing insights from traces stored in Grafana Tempo, Grafana Cloud Traces, and Grafana Enterprise Traces.
Explore Traces helps you make sense of your tracing data so you can automatically visualize insights from your Tempo traces data. The app helps you understand errors and latency issues within complex distributed systems.
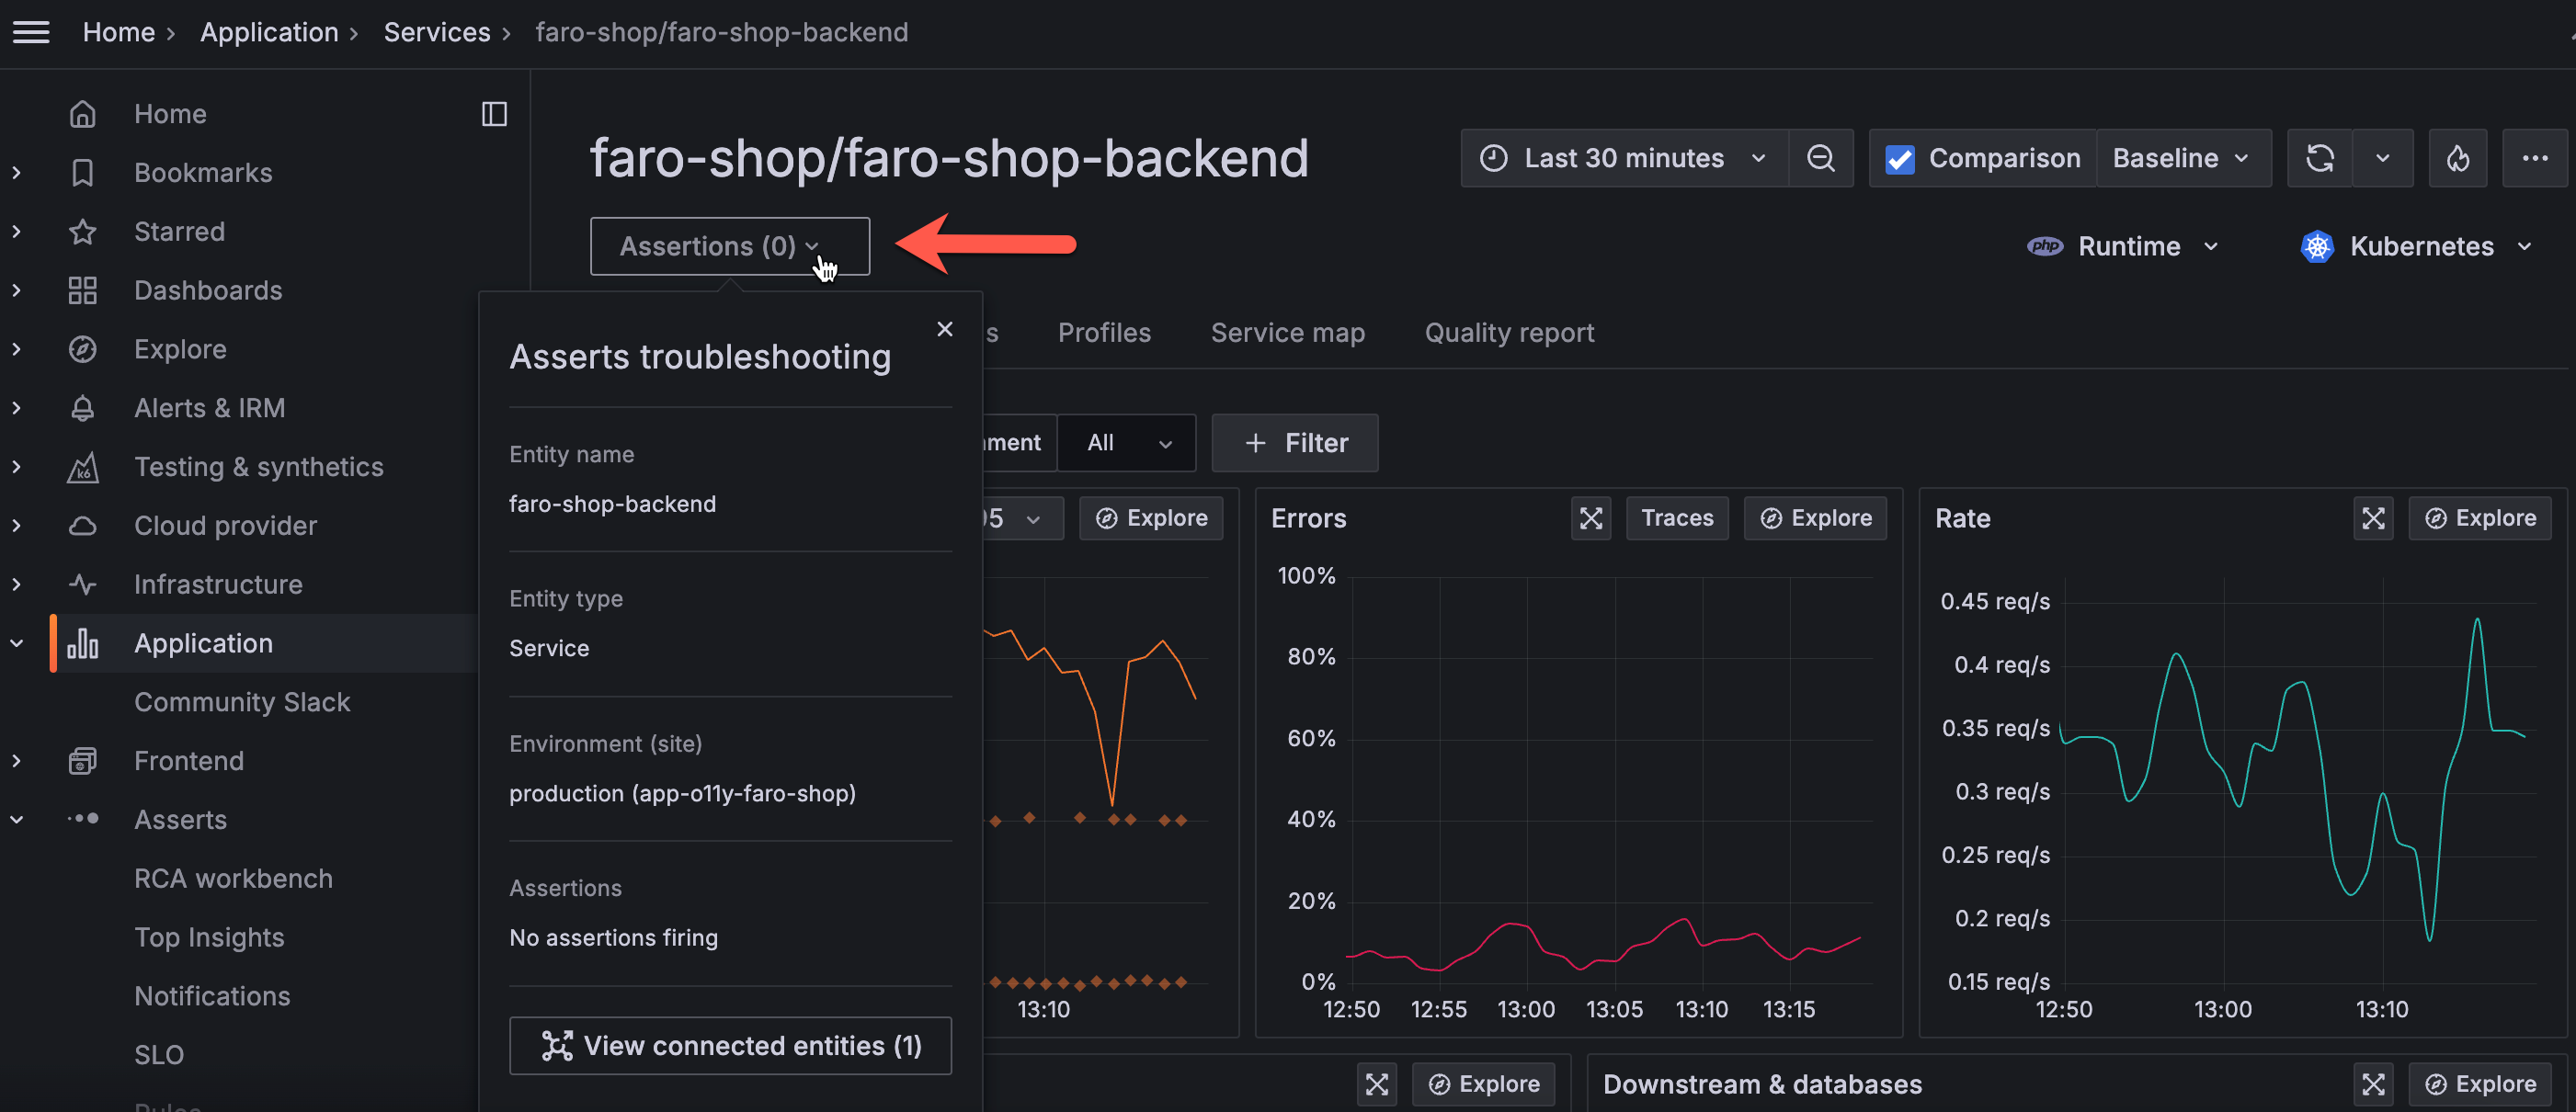
Contextual root cause analysis workflows
Asserts now supports root cause analysis bi-directional navigation between Asserts and Grafana Application Observability and Kubernetes Monitoring. When you are in Application Observability or Kubernetes Monitoring, you can seamlessly explore Assertions in Asserts without losing context. When in Asserts, you can easily navigate to Application Observability or Kubernetes Monitoring.
To help make it easier for administrators to assess and interact with Grafana plugins, we are reworking the plugin details page to highlight important metadata, such as when the plugin was last updated.

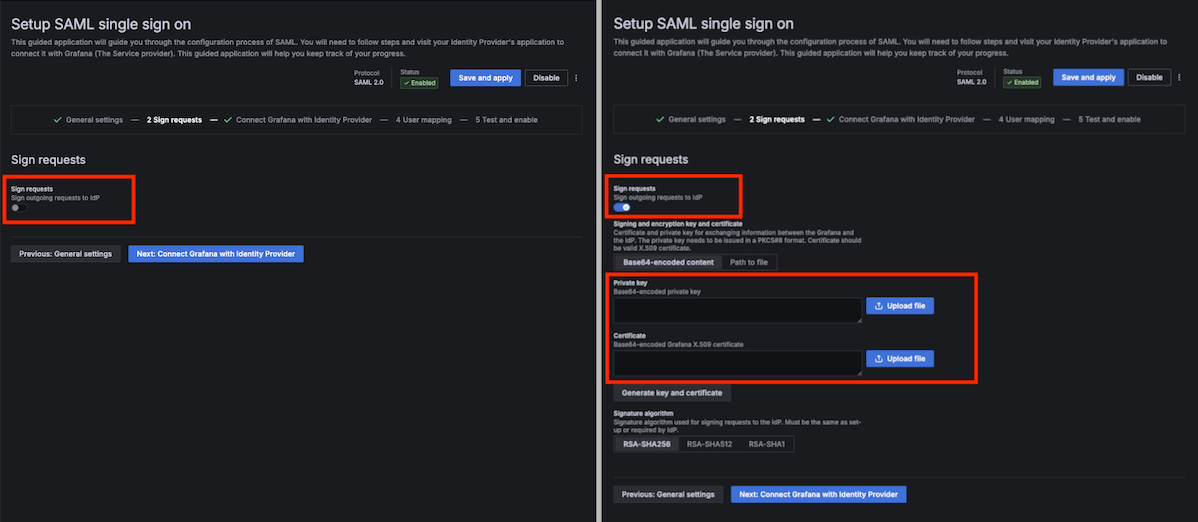
The private key and certificate fields are no longer mandatory in the SAML form. To configure SAML without providing a private key and a certificate you have to opt out from using signed requests.
We’ll be improving the scalability, reliability, and functionality of 6 synthetic monitoring probe locations by moving them to AWS: Frankfurt, Singapore, London, Mumbai, Sydney, and Tokyo. This change will bring static IPv4 addresses and IPv6 CIDR ranges for more reliable allow-listing, as well as make k6-powered scripted checks available in these locations. The locations will be upgraded to a new public probe architecture with improved reliability.
We’ve streamlined the onboarding process for OnCall, making it quicker and easier for new users to get started.
Now, new users can access OnCall immediately without waiting for an admin to log in. OnCall initialization has been moved to the backend, reducing setup time and minimizing potential errors. Additionally, user synchronization between Grafana and OnCall is significantly faster, so newly created users can start using OnCall within minutes—without any delays or extra steps.
Webhooks are a useful and flexible way to interact with third-party services. While OnCall has supported advanced webhook integrations for some time, they were previously limited to automatic triggers, such as event-based triggers (e.g., alert group status changes) or escalation chain steps.

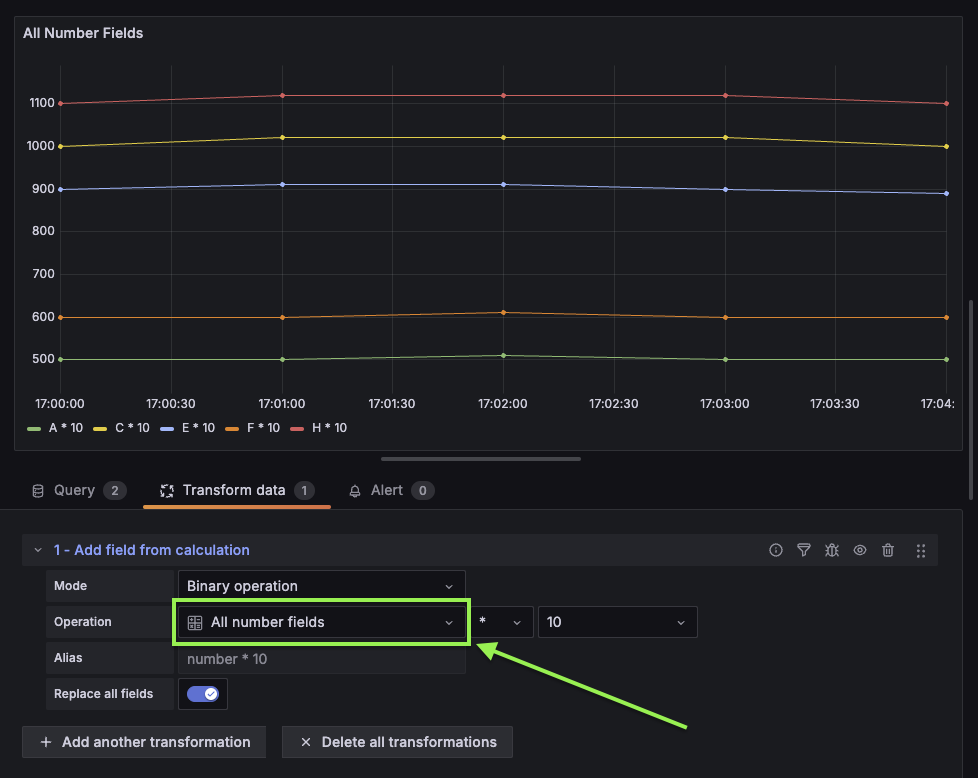
We’ve made a helpful update to the Binary operation mode of the Add field from calculation transformation!
When you set up a binary operation calculation, there’s a new All number fields option available to select. Use this to apply a mathematical operator to multiple number fields simultaneously. This feature is particularly useful when you’re scaling or offsetting data containing multiple, dynamically named fields, allowing the transformation to be applied when dealing with unknown field names.
Jumpstart your alert creation and customization. Throughout Kubernetes Monitoring, panels from CPU usage to cost are ready for you to create and customize an alert.