Improve performance and clarity with legend limits
Panels displaying hundreds or thousands of series can potentially run into performance bottlenecks when rendering their legends. Each legend item adds DOM nodes to the page, and that can add up when your visualization displays thousands of series. It can also be visually distracting if your user is not actively engaging with the legend.
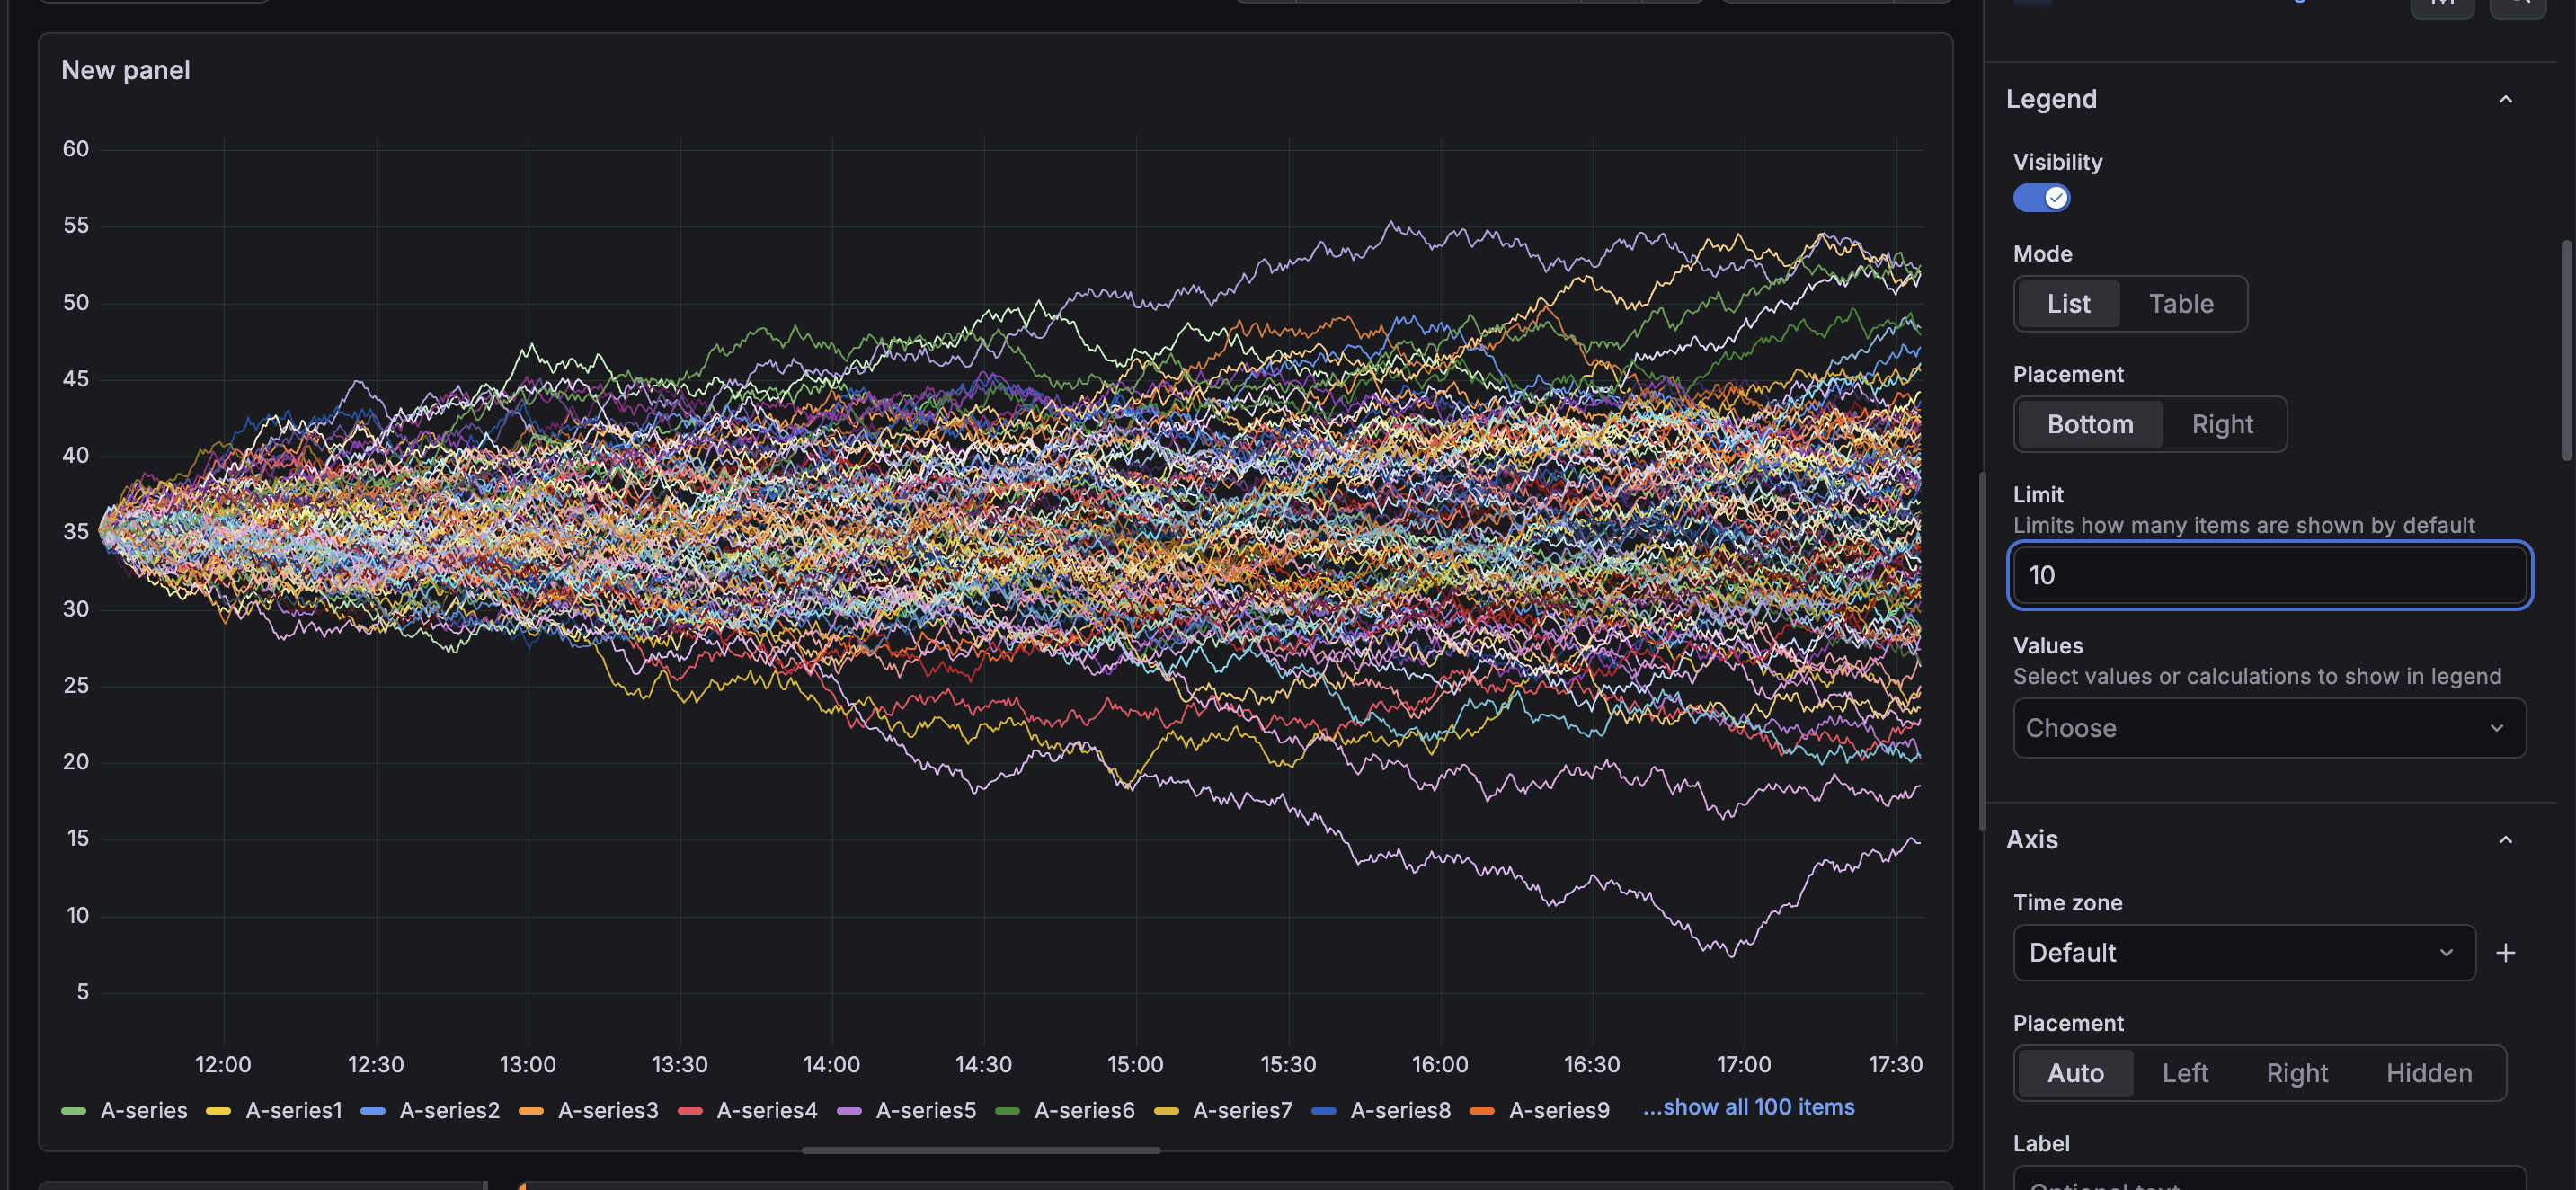
To address this, Grafana now includes a Limit option in the legend settings. Set a numeric value to control how many series items appear in the legend by default. When the series count exceeds the limit, a Show all link allows you to see the full list of series.
The visualization itself is unaffected—all series continue to render in the chart regardless of the legend limit.
The Limit option is available in the legend settings for the following visualizations: time series, bar chart, bar gauge, candlestick, histogram, pie chart, state timeline, status history, trend, and XY chart.