What's new from Grafana Labs
Grafana Assistant available in Kubernetes Monitoring
You can use Grafana Assistant in Kubernetes Monitoring to:
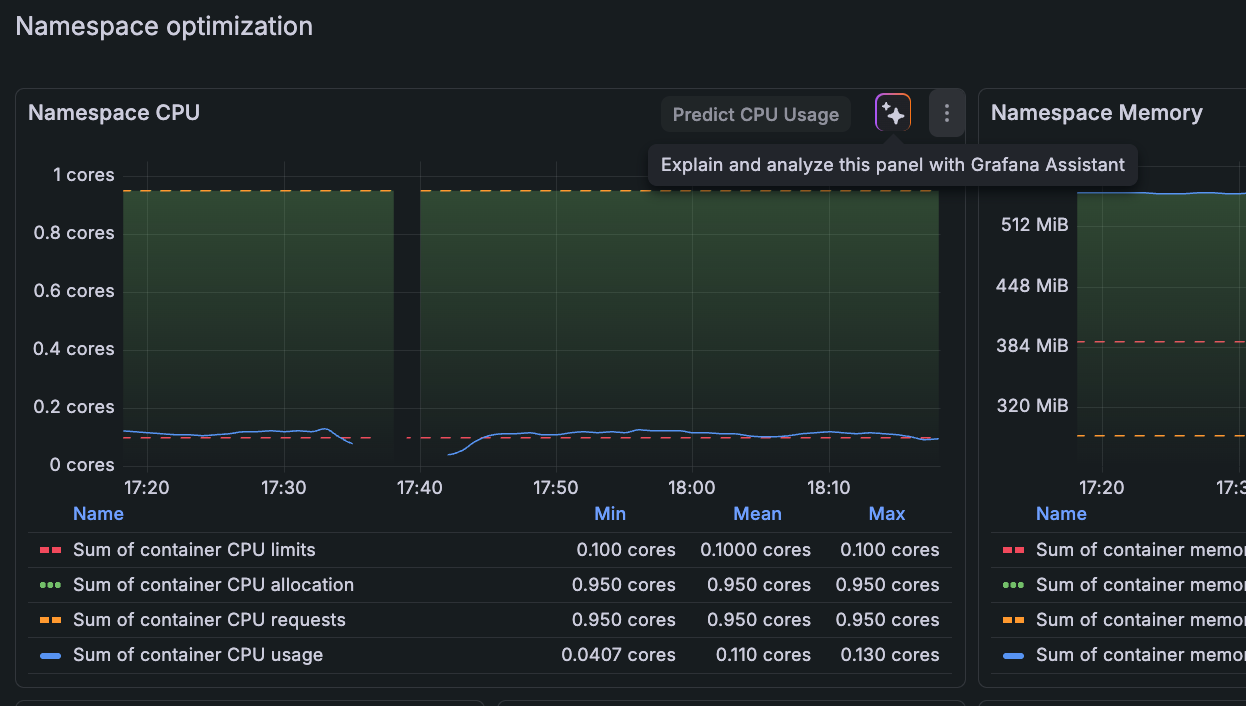
- Explain the data you see in a panel or on a detail page
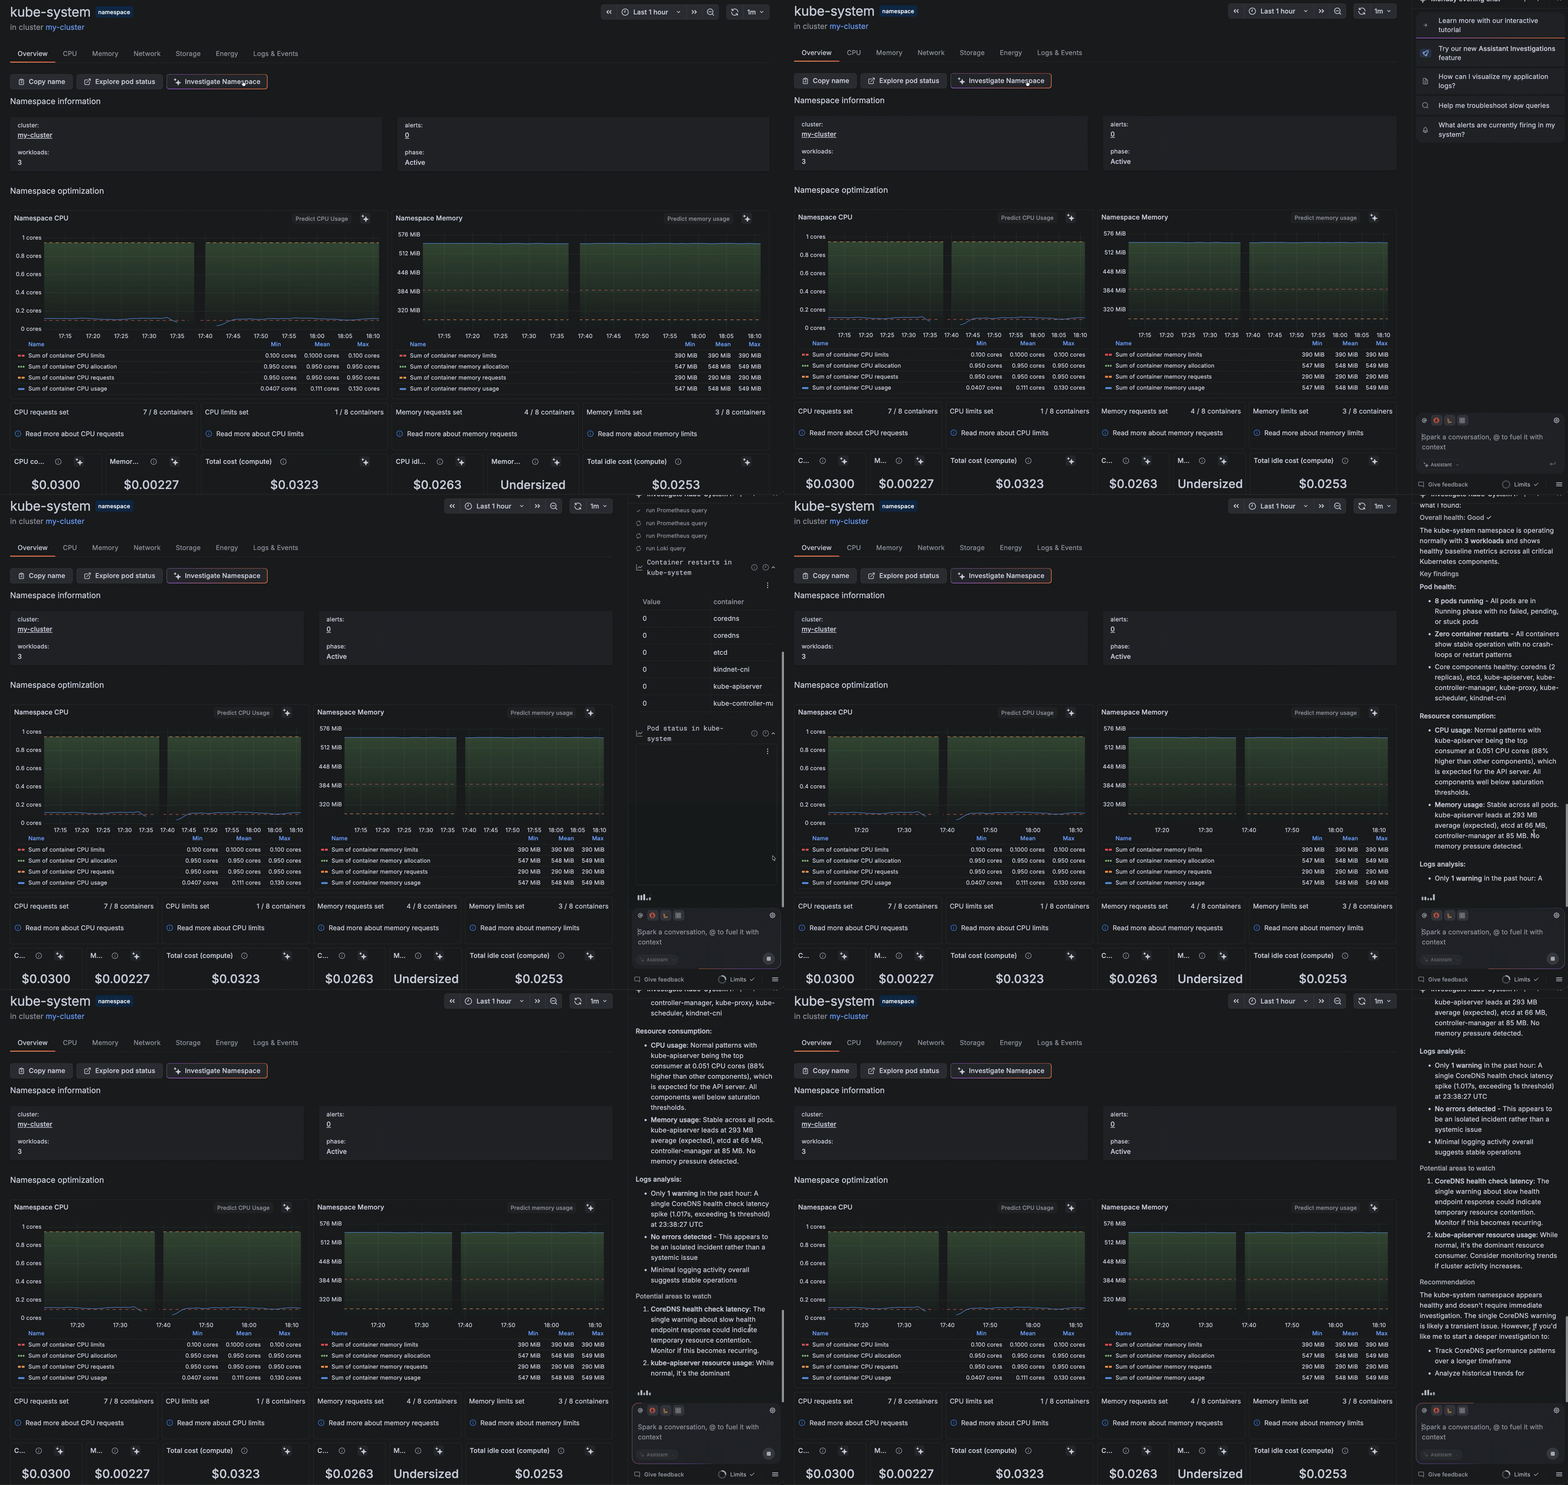
- Start an investigation for potential issues
- Review the health of Kubernetes objects and resource consumption
- Provide recommendations
- Launch an investigation
- Follow any additional queries or commands you give it
To use the Assistant, click any Assistant icon available on a panel.

Or on any detail page, click the Investigate button.

Related What's new posts