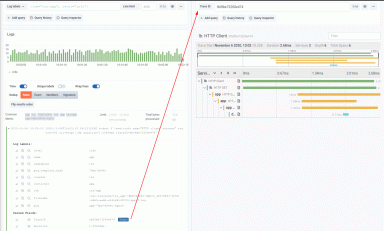
Intro to exemplars, which enable Grafana Tempo’s distributed tracing at massive scale
Read more
Products
LGTM+ Stack
Key Capabilities
Observability Solutions
Open Source
Community resources
Dashboard templates
Try out and share prebuilt visualizations
Prometheus exporters
Get your metrics into Prometheus quickly
end-to-end solutions
Opinionated solutions that help you get there easier and faster
monitor infrastructure
Out-of-the-box KPIs, dashboards, and alerts for observability
visualize any data
Instantly connect all your data sources to Grafana
Learn
Stay up to date
Technical learning
Docs
Get started
Get started with Grafana
Build your first dashboard
Get started with Grafana Cloud
What's new / Release notes
Company
Help build the future of open source observability software Open positions
Check out the open source projects we support Downloads
end-to-end solutions
Opinionated solutions that help you get there easier and faster
visualize any data
Instantly connect all your data sources to Grafana
Richard "RichiH" Hartmann · 31 Mar 2021 · 6 min read
Read more
Marty Disibio · 11 Feb 2021 · 7 min read
Read more
Éamon Ryan · 8 Feb 2021 · 6 min read
This Splunk Enterprise plugin for Grafana allows you to navigate between logs as well as Grafana Tempo, Zipkin, and Jaeger tracing backends without...
Read more
Ivana Huckova · 4 Feb 2021 · 5 min read
Read more
Grafana Labs Team · 25 Jan 2021 · 8 min read
Introduction to distributed tracing with Jaeger and Tempo and how they integrate with Loki and Grafana.
Read more
Joe Elliott · 7 Dec 2020 · 3 min read
Read more
Robert Fratto · 17 Nov 2020 · 7 min read
Read more
Joe Elliott · 9 Nov 2020 · 4 min read
Read more
Joe Elliott · 27 Oct 2020 · 4 min read
Read more
Julie Dam · 5 Aug 2020 · 1 min read
Read more
Joe Elliott · 30 Jul 2020 · 5 min read
Read more
Joe Elliott · 9 Jul 2020 · 6 min read
Read more
Annanay Agarwal · 18 Jun 2020 · 4 min read
Read more
Joey Bartolomeo · 31 Mar 2020 · 8 min read
Read more
David Kaltschmidt · 22 Nov 2019 · 3 min read
Read more