A practical guide to data collection with OpenTelemetry and Prometheus
Here are seven best practices that will help optimize the interoperability of OpenTelemetry and Prometheus
Read more
Products
Grafana Cloud
Monitor, analyze, and act faster with AI-powered observability.
LGTM+ Stack
Key Capabilities
Observability Solutions
end-to-end solutions
Opinionated solutions that help you get there easier and faster
monitor infrastructure
Out-of-the-box KPIs, dashboards, and alerts for observability
visualize any data
Instantly connect all your data sources to Grafana
Grafana Cloud
Monitor, analyze, and act faster with AI-powered observability.
The actually useful free plan
10k series Prometheus metrics
50GB logs, 50GB traces, 50GB profiles
500VUh k6 testing
20+ Enterprise data source plugins
100+ pre-built solutions
Opinionated solutions that help you get there easier and faster
Instantly connect all your data sources to Grafana
Getting started with managing your metrics, logs, and traces using Grafana
Learn how to unify, correlate, and visualize data with dashboards using Grafana.
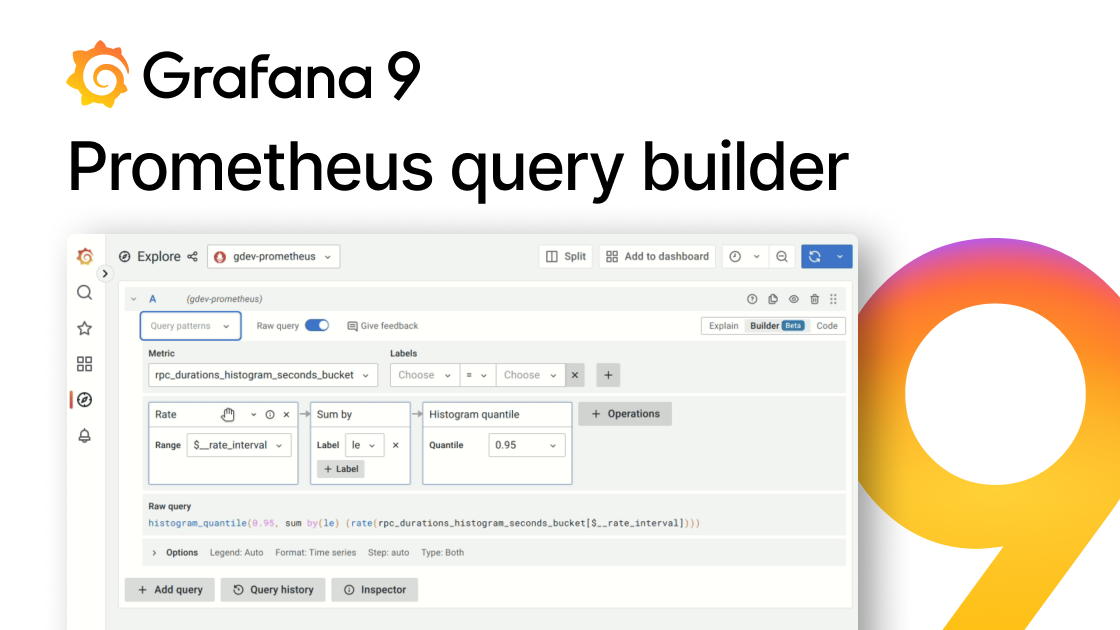
Here are seven best practices that will help optimize the interoperability of OpenTelemetry and Prometheus
Read more
Read more
Read more
Read more
Read more
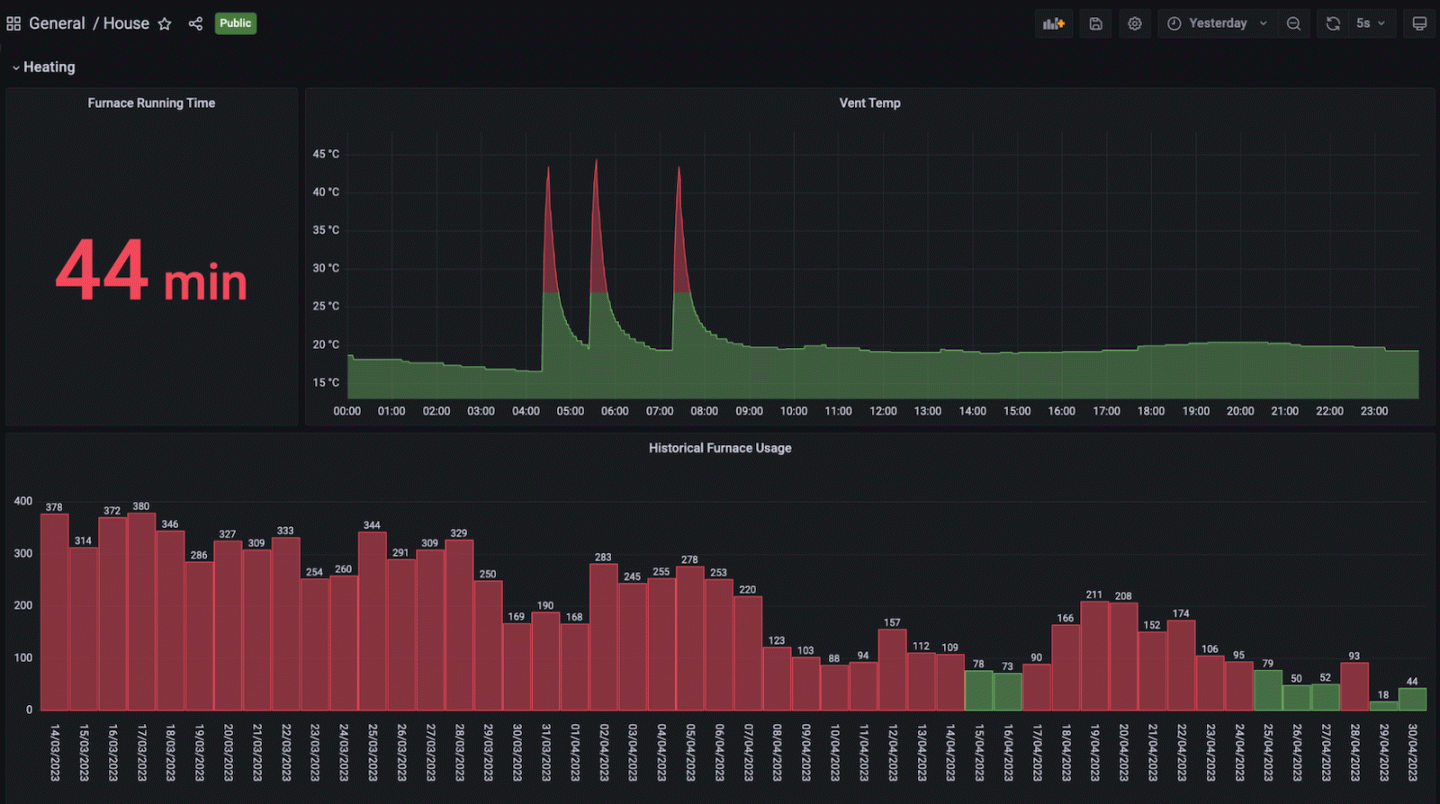
Visualizing xDSL metrics on a Grafana dashboard makes it easy to figure out the cause of short-term internet outages.
Read more
Read more
Read more
Read more
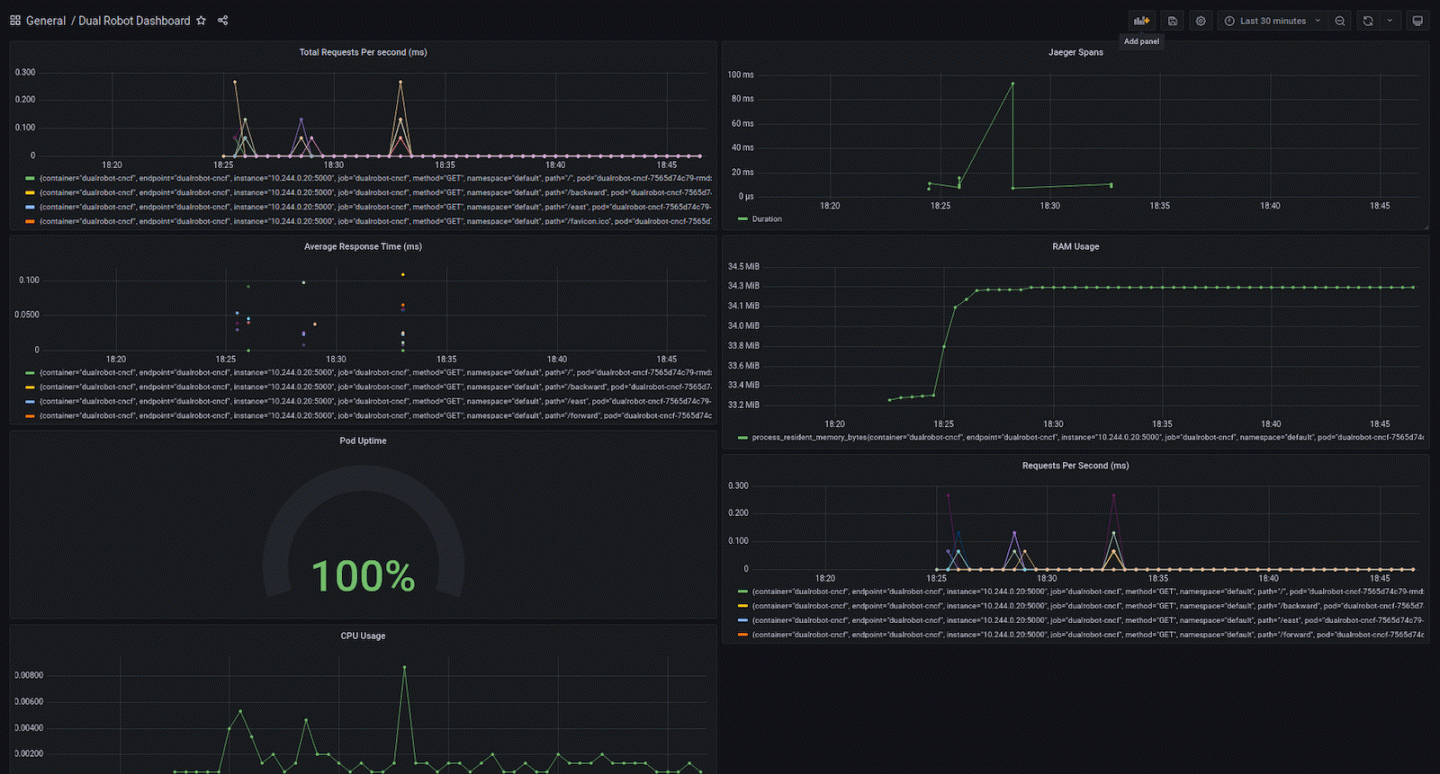
Check out what Grafana Labs is up to at KubeCon + CloudNativeCon. Find our booth and check out our sessions on Jaeger, Prometheus, SLOs, and SneakOps.
Read more
Read more
Read more
Read more
Read more
Read more