How to successfully correlate metrics, logs, and traces in Grafana
Read more
Products
LGTM+ Stack
Key Capabilities
Observability Solutions
Open Source
Community resources
Dashboard templates
Try out and share prebuilt visualizations
Prometheus exporters
Get your metrics into Prometheus quickly
end-to-end solutions
Opinionated solutions that help you get there easier and faster
monitor infrastructure
Out-of-the-box KPIs, dashboards, and alerts for observability
visualize any data
Instantly connect all your data sources to Grafana
Learn
Stay up to date
Technical learning
Docs
Get started
Get started with Grafana
Build your first dashboard
Get started with Grafana Cloud
What's new / Release notes
Company
Help build the future of open source observability software Open positions
Check out the open source projects we support Downloads
end-to-end solutions
Opinionated solutions that help you get there easier and faster
visualize any data
Instantly connect all your data sources to Grafana
Joey Bartolomeo · 31 Mar 2020 · 8 min read
Read more
Robert Fratto · 18 Mar 2020 · 5 min read
Read more
Edward Spencer · 16 Mar 2020 · 2 min read
Read more
Joe Elliott · 4 Mar 2020 · 2 min read
Read more
Ivana Huckova · 25 Feb 2020 · 8 min read
How to get started with Prometheus Alertmanager and set up alert notifications with popular methods and apps.
Read more
Malcolm Holmes · 24 Feb 2020 · 3 min read
Read more
Ryan McKinley · 13 Feb 2020 · 1 min read
Read more
Malcolm Holmes · 10 Feb 2020 · 3 min read
Read more
Emil Tullstedt · 4 Feb 2020 · 12 min read
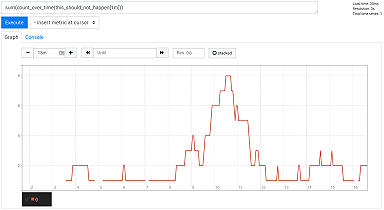
Interested in learning about PromQL? Here’s an introductory tutorial.
Read more
Richard "RichiH" Hartmann · 31 Jan 2020 · 4 min read
Read more
Goutham Veeramachaneni · 21 Jan 2020 · 11 min read
Read more
Rachel Chang · 16 Jan 2020 · 11 min read
Read more
Diana Payton · 15 Jan 2020 · 3 min read
Read more
Julie Dam · 10 Jan 2020 · 3 min read
Read more
Joey Bartolomeo · 8 Jan 2020 · 12 min read
Read more