What’s new in Grafana Enterprise Metrics 1.3, our scalable, self-hosted Prometheus service
Read more
Products
LGTM+ Stack
Key Capabilities
Observability Solutions
IRM
Deploy The Stack
Open Source
Community resources
Dashboard templates
Try out and share prebuilt visualizations
Prometheus exporters
Get your metrics into Prometheus quickly
end-to-end solutions
Opinionated solutions that help you get there easier and faster
monitor infrastructure
Out-of-the-box KPIs, dashboards, and alerts for observability
visualize any data
Instantly connect all your data sources to Grafana
Learn
Stay up to date
Technical learning
Docs
Get started
Get started with Grafana
Build your first dashboard
Get started with Grafana Cloud
What's new / Release notes
Help build the future of open source observability software Open positions
Check out the open source projects we support Downloads
Deploy The Stack
end-to-end solutions
Opinionated solutions that help you get there easier and faster
visualize any data
Instantly connect all your data sources to Grafana
Jen Villa · 29 Apr 2021 · 5 min read
Read more
Mitch Seaman · 19 Apr 2021 · 3 min read
Read more
Simeon Yep · 14 Apr 2021 · 2 min read
Read more
Christine Wang · 30 Mar 2021 · 6 min read
The Jira data source plugin in Grafana can give users across your organization comprehensive insights into their development process.
Read more
Grafana Labs Team · 19 Mar 2021 · 2 min read
Read more
Joey Bartolomeo · 17 Mar 2021 · 3 min read
Read more
Raj Dutt · 4 Mar 2021 · 2 min read
Read more
Joan López de la Franca · 25 Feb 2021 · 7 min read
The GitLab data source plugin allows users to visualize development metrics and correlate them with events in Grafana.
Read more
Mike Johnson · 22 Feb 2021 · 5 min read
The Splunk Infrastructure Monitoring plugin for Grafana enables a flexible view of your systems and applications to quickly correlate and debug.
Read more
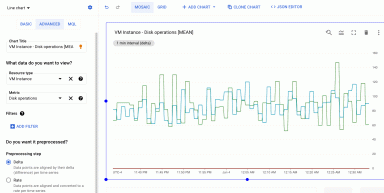
Éamon Ryan · 8 Feb 2021 · 6 min read
This Splunk Enterprise plugin for Grafana allows you to navigate between logs as well as Grafana Tempo, Zipkin, and Jaeger tracing backends without...
Read more
Ryan McKinley · 16 Dec 2020 · 2 min read
Read more
Scott Lepper · 2 Nov 2020 · 5 min read
The MongoDB Enterprise plugin unlocks all of the data stored in MongoDB — including diagnostic metrics for monitoring MongoDB itself — for Grafana...
Read more
Eldin Nikocevic · 23 Oct 2020 · 4 min read
With the Snowflake plugin, you can visualize your Snowflake data alongside your other data sources in Grafana.
Read more
Mike Johnson · 5 Oct 2020 · 6 min read
Read more
Andrej Ocenas · 5 Oct 2020 · 4 min read
Read more
Bring your crew,
save up to 20%
Don't miss out—Be the first to dive into Grafana 12, Prometheus 3.0, and our nearly sold-out hands-on labs on Grafana as Code, OpenTelemetry, and more.
After last year's record sellout, our biggest community event is headed to Seattle on May 6-8! Discover what's new in Grafana 12, learn from 20+ talks covering Prometheus, OpenTelemetry, & Loki, and much more.
No credit card needed, ever.
Become a Champion
Helping others embodies the spirit of open source, and we want to celebrate your invaluable contributions.
Become a ChampionGolden Grots
Helping others embodies the spirit of open source, and we want to celebrate your invaluable contributions.
Submit your dashboardBecome a Contributor
Helping others embodies the spirit of open source, and we want to celebrate your invaluable contributions.
Gain insight into unused metrics and optimize metric cardinality with the new cardinality management dashboards and Adaptive Metrics