• Products Open Source Solutions Learn Docs Pricing
  • Downloads Contact us Sign in
Create free account Contact us

Products

Grafana Cloud

Monitor, analyze, and act faster with AI-powered observability.

Grafana Cloud
Grafana Cloud overview

LGTM+ Stack

Grafana Cloud Logs

Logs

powered by Grafana Loki

Grafana

Grafana

for visualization

Grafana Cloud Traces

Traces

powered by Grafana Tempo

Grafana Cloud Metrics

Metrics

powered by Grafana Mimir and Prometheus

Key Capabilities

AI/ML

AI/ML insights

Identify anomalies and reduce toil

Grafana Cloud Asserts

Contextual root cause analysis

Automated anomaly correlation

Grafana SLO

SLO management

Create SLOs and error budget alerts

Grafana Alerting

Alerting

Trigger alerts from any data source

Plugins

Plugins

Connect Grafana to data sources, apps, and more

Observability Solutions

Application Observability

Application Observability

Monitor application performance

Infrastructure Observability

Infrastructure observability

Ensure infrastructure health and performance

Testing

Grafana Cloud k6

Performance testing

Powered by Grafana k6

Synthetic Monitoring

Synthetic Monitoring

powered by Grafana k6

IRM

Incident

Incident response

Routine task automation for incidents

OnCall

On-call management

Flexible on-call management

Open Source

Grafana Loki

Multi-tenant log aggregation system

Grafana

Query, visualize, and alert on data

Grafana Tempo

High-scale distributed tracing backend

Grafana Mimir

Scalable and performant metrics backend

Grafana Pyroscope

Scalable continuous profiling backend

Grafana Beyla

eBPF auto-instrumentation

Grafana Faro

Frontend application observability web SDK

Grafana Alloy

OpenTelemetry Collector distribution with Prometheus pipelines

Grafana k6

Load testing for engineering teams

Prometheus

Monitor Kubernetes and cloud native

OpenTelemetry

Instrument and collect telemetry data

Graphite

Scalable monitoring for time series data

All

Community resources

Dashboard templates

Try out and share prebuilt visualizations

Prometheus exporters

Get your metrics into Prometheus quickly

end-to-end solutions

Opinionated solutions that help you get there easier and faster

Kubernetes Monitoring

Get K8s health, performance, and cost monitoring from cluster to container

Application Observability

Monitor application performance

Frontend Observability

Gain real user monitoring insights

Incident Response & Management

Detect and respond to incidents with a simplified workflow

All monitoring and visualization solutions

monitor infrastructure

Out-of-the-box KPIs, dashboards, and alerts for observability

linux server logo
Linux
windows logo
Windows
docker logo
Docker
postgresql logo
Postgres
mysql logo
MySQL
aws logo
AWS
kafka logo
Kafka
jenkins logo
Jenkins
rabbitmq logo
RabbitMQ
mongodb logo
MongoDB
microsoft azure observability logo
Microsoft Azure
google cloud observability with grafana cloud logo
Google Cloud
All monitoring solutions

visualize any data

Instantly connect all your data sources to Grafana

mongodb logo
MongoDB
appdynamics logo
AppDynamics
oracle database logo
Oracle
gitlab logo
GitLab
jira logo
Jira
salesforce logo
Salesforce
splunk logo
Splunk
datadog logo
Datadog
new relic logo
New Relic
snowflake logo
Snowflake
All visualization solutions

Learn

Community and events

Events

Upcoming in-person and virtual events

ObservabilityCON 2025 (7-9 Oct)

Our flagship observability event

GrafanaCON 2025

Our annual OSS community conference

ObservabilityCON on the Road

Our observability conference on the road

Community

Join the Grafana community

Community forums

Ask the community for help

Resources

Blog

News, releases, cool stories, and more

Observability survey report 2025

Industry insights on the state of observability

Benefits of Observability

New research, reports, and insights

Success stories

By use case, product, and industry

How-to

Documentation

All the docs

Webinars and videos

Demos, webinars, and feature tours

Tutorials

Step-by-step guides

Workshops

Free, in-person or online

Learning Journeys

Expert guidance for mastering our platform

Professional Services

Expert guidance and training

Docs
Pricing

Help build the future of open source observability software Open positions

Check out the open source projects we support Downloads

Sign in

Grafana Cloud

Monitor, analyze, and act faster with AI-powered observability.

Grafana Cloud
Grafana Cloud overview

LGTM+ Stack

Grafana Cloud Logs

Logs

Grafana

Grafana

Grafana Cloud Traces

Traces

Grafana Cloud Metrics

Metrics

Key Capabilities

AI/ML

AI/ML insights

Grafana Cloud Asserts

Contextual root cause analysis

Grafana SLO

SLO management

Grafana Alerting

Alerting

Plugins

Plugins

Observability Solutions

Application Observability

Application Observability

Infrastructure Observability

Infrastructure observability

Testing

Grafana Cloud k6

Performance testing

Synthetic Monitoring

Synthetic Monitoring

IRM

Incident

Incident response

OnCall

On-call management

The actually useful free plan

Grafana Cloud Free Tier
check

10k series Prometheus metrics

check

50GB logs, 50GB traces, 50GB profiles

check

500VUk k6 testing

check

20+ Enterprise data source plugins

check

100+ pre-built solutions

Create account
Grafana Cloud Logs

Grafana Loki

Multi-tenant log aggregation system

Grafana

Grafana

Query, visualize, and alert on data

Grafana Cloud Traces

Grafana Tempo

High-scale distributed tracing backend

Grafana Cloud Metrics

Grafana Mimir

Scalable and performant metrics backend

Grafana Cloud Profiles

Grafana Pyroscope

Scalable continuous profiling backend

Grafana Beyla

eBPF auto-instrumentation

Grafana Faro

Grafana Faro

Frontend application observability web SDK

Grafana Alloy

Grafana Alloy

OpenTelemetry Collector distribution with Prometheus pipelines

Grafana Cloud k6

Grafana k6

Load testing for engineering teams

Prometheus

Prometheus

Monitor Kubernetes and cloud native

OpenTelemetry

OpenTelemetry

Instrument and collect telemetry data

Graphite

Graphite

Scalable monitoring for time series data

All

Community resources

Dashboard templates
Try out and share prebuilt visualizations
Prometheus exporters
Get your metrics into Prometheus quickly

end-to-end solutions

Opinionated solutions that help you get there easier and faster

Kubernetes Monitoring

Kubernetes Monitoring

Get K8s health, performance, and cost monitoring from cluster to container

Application Observability

Application Observability

Monitor application performance

Frontend Observability

Frontend Observability

Gain real user monitoring insights

Incident Response & Management

Incident Response & Management

Detect and respond to incidents with a simplified workflow

monitor infrastructure

Out-of-the-box KPIs, dashboards, and alerts for observability

linux server logo Linux
windows logo Windows
docker logo Docker
postgresql logo Postgres
mysql logo MySQL
aws logo AWS
kafka logo Kafka
jenkins logo Jenkins
rabbitmq logo RabbitMQ
mongodb logo MongoDB
microsoft azure observability logo Microsoft Azure
google cloud observability with grafana cloud logo Google Cloud

visualize any data

Instantly connect all your data sources to Grafana

mongodb logo MongoDB
appdynamics logo AppDynamics
oracle database logo Oracle
gitlab logo GitLab
jira logo Jira
salesforce logo Salesforce
splunk logo Splunk
datadog logo Datadog
new relic logo New Relic
snowflake logo Snowflake
All monitoring and visualization solutions

Community and events

Events

ObservabilityCON 2025 (7-9 Oct)

GrafanaCON 2025

ObservabilityCON on the Road

Community

Community forums

Resources

Blog

Observability survey report 2025

Benefits of Observability

Success stories

How-to

Documentation

Webinars and videos

Tutorials

Workshops

Learning Journeys

Professional Services

Featured webinar

Getting started with grafana LGTM stack

Getting started with managing your metrics, logs, and traces using Grafana

Learn how to unify, correlate, and visualize data with dashboards using Grafana.

Learn more →
Try using Grot AI Grot AI for this query ->
Blog
  • All
  • Community
  • Culture
  • Engineering
  • News
  • Release
Blog
  • All
  • Community
  • Culture
  • Engineering
  • News
  • Release
Tags

Plugins

View all tags
Visualize Sumo Logic metrics and logs with Grafana: Introducing the Sumo Logic Enterprise plugin

Kuba Siemiatkowski   ·   1 Feb 2024   ·   6 min read

Visualize Sumo Logic metrics and logs with Grafana: Introducing the Sumo Logic Enterprise plugin

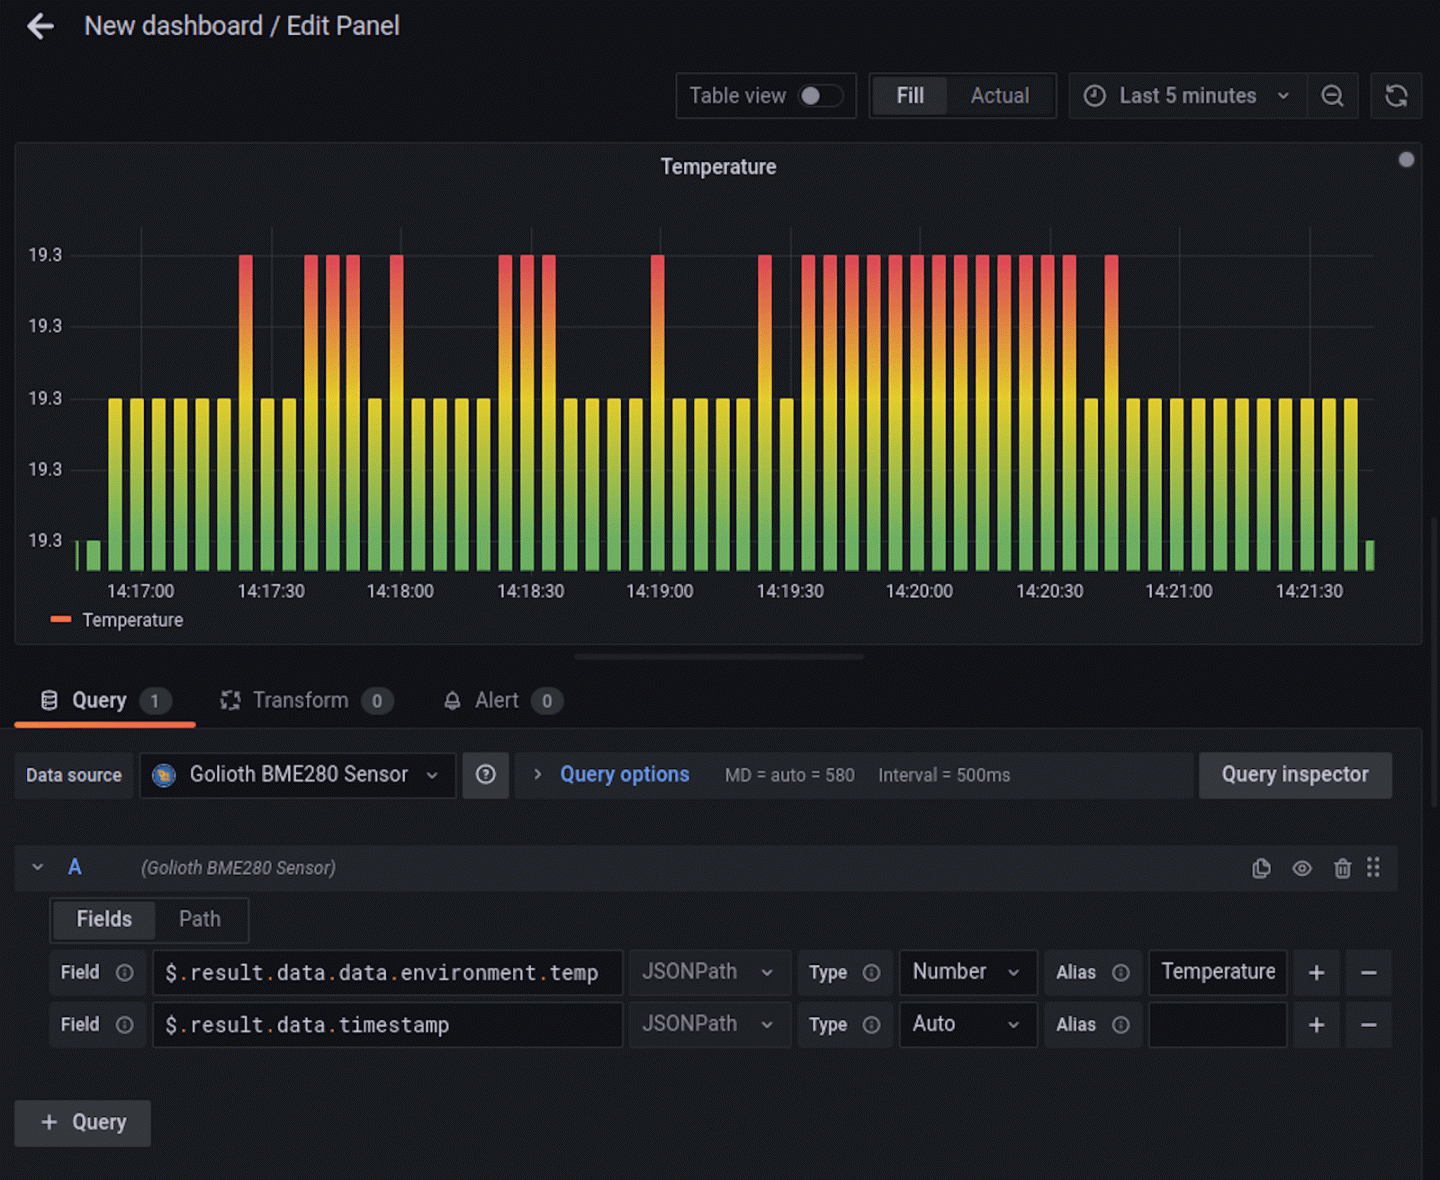
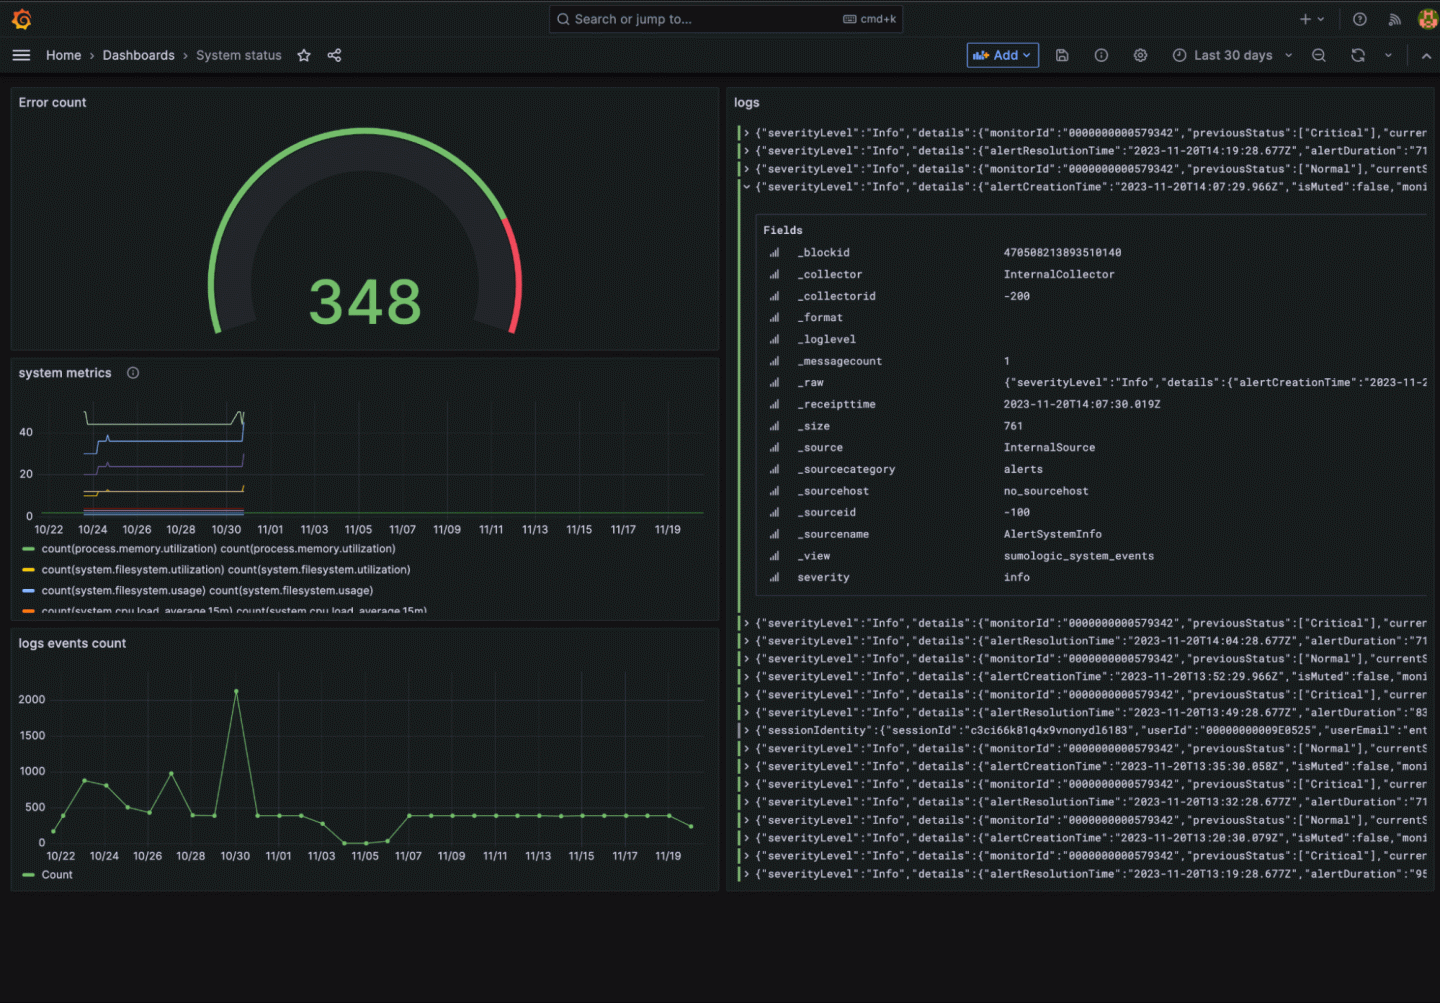
You can now easily connect Sumo Logic to your Grafana instance and visualize your Sumo Logic logs and metrics.

Plugins

Read more


The Grafana developer portal: your gateway to enhanced plugin development

Joe Perez   ·   26 Oct 2023   ·   5 min read

The Grafana developer portal: your gateway to enhanced plugin development

The all-new Grafana developer portal is a central hub of curated resources for developers who want to extend Grafana's capabilities.

Grafana
Plugins
DevOps
Community

Read more


Grafana JSON API: How to import third-party data sources in Grafana Cloud

Nick Landreville   ·   30 Aug 2023   ·   5 min read

Grafana JSON API: How to import third-party data sources in Grafana Cloud

In less that five minutes you can import publicly available third-party data into a Grafana Cloud dashboard using the Grafana JSON API plugin.

Monitoring
Plugins

Read more


Lessons learned from integrating OpenAI into a Grafana data source

Adam Simpson   ·   25 Jul 2023   ·   7 min read

Lessons learned from integrating OpenAI into a Grafana data source

How does generative AI fit in the context of a Grafana data source? Find out what we learned when we incorporated OpenAI into the ADX query editor.

Plugins

Read more


How to monitor Kubernetes network and security events with Hubble and Grafana

Anna Kapuścińska   ·   13 Jul 2023   ·   6 min read

How to monitor Kubernetes network and security events with Hubble and Grafana

Plugins
Grafana

Read more


Retain logs longer without breaking the bank: Introducing Grafana Cloud Logs Export

Steven Dungan   ·   8 Jun 2023   ·   4 min read

Retain logs longer without breaking the bank: Introducing Grafana Cloud Logs Export

Whether it's for compliance purposes or to analyze past incidents, use Grafana Cloud Logs Exporter to transfer your logs — for free! — to your own...

Grafana Cloud
Integrations
Plugins

Read more


Visualize real-time mobile app data with the Embrace data source plugin for Grafana

Chakshu Mehta   ·   13 Feb 2023   ·   5 min read

Visualize real-time mobile app data with the Embrace data source plugin for Grafana

Gain full-stack observability into the end user's experience with the new Embrace data source plugin for Grafana

Plugins

Read more


Five eye-catching Grafana visualizations used by Energy Sciences Network to monitor network data

Katrina Turner   ·   24 Jan 2023   ·   6 min read

Five eye-catching Grafana visualizations used by Energy Sciences Network to monitor network data

Plugins

Read more


Is your plugin compatible with Grafana? There's a tool for that!

Esteban Beltran   ·   14 Sep 2022   ·   2 min read

Is your plugin compatible with Grafana? There's a tool for that!

Grafana
Dashboard
Plugins

Read more


Video: How to get started with MongoDB and Grafana

Vijay Tolani   ·   9 Aug 2022   ·   2 min read

Video: How to get started with MongoDB and Grafana

Plugins

Read more


How to access and query REST APIs with the Sqlyze plugin in Grafana

Scott Lepper   ·   12 Jul 2022   ·   3 min read

How to access and query REST APIs with the Sqlyze plugin in Grafana

Plugins
Grafana

Read more


Grafana for business intelligence: How Grafana Labs uses dashboards for more than observability data

Chris Shih   ·   31 May 2022   ·   6 min read

Grafana for business intelligence: How Grafana Labs uses dashboards for more than observability data

How we use the BigQuery plugin, dbt, and Grafana for business intelligence in our modern data stack.

Grafana
Plugins

Read more


Monitoring COVID-19 virus levels in wastewater using Grafana, Databricks, and the Sqlyze plugin

Scott Lepper   ·   18 May 2022   ·   6 min read

Monitoring COVID-19 virus levels in wastewater using Grafana, Databricks, and the Sqlyze plugin

A look at how Grafana, Databricks, and the new Sqlyze plugin work together to visualize an enormous amount of data and deliver valuable insights...

Plugins

Read more


Introducing the official ClickHouse plugin for Grafana

Tyler Hannan   ·   5 May 2022   ·   4 min read

Introducing the official ClickHouse plugin for Grafana

The new first-party ClickHouse plugin comes with pre-configured dashboards and alerts in Grafana.

Plugins

Read more


How to use WebSockets to visualize real-time IoT data in Grafana

Mike Szczys   ·   5 Apr 2022   ·   5 min read

How to use WebSockets to visualize real-time IoT data in Grafana

With the WebSockets plugin, you can use a Grafana panel to get immediate feedback on the health of your devices.

Plugins
IoT
Grafana

Read more


  • ««
  • «
  • 1
  • 2
  • 3
  • 4
  • 5
  • »
  • »»
Sign up for Grafana stack updates
Note: By signing up, you agree to be emailed related product-level information.


Products
  • Grafana Cloud
  • Grafana Enterprise Stack
  • Grafana visualizations
  • Plugins
  • Grafana Cloud Logs
  • Grafana Cloud Metrics
  • Grafana Cloud Traces
  • Grafana Cloud Profiles
  • AI/ML tools for observability
  • Application Observability
  • Frontend Observability
  • Grafana Cloud Asserts
  • Grafana IRM
  • Grafana k6
  • Grafana SLO
  • Synthetic Monitoring
  • Solutions
  • Pricing
Open Source
  • Grafana
  • Grafana Alloy
  • Grafana Beyla
  • Grafana Faro
  • Grafana k6
  • Grafana Loki
  • Grafana Mimir
  • Grafana OnCall
  • Grafana Pyroscope
  • Grafana Tanka
  • Grafana Tempo
  • Graphite
  • OpenTelemetry
  • Prometheus
  • Dashboard templates
  • Downloads
  •   GitHub
Learn
  • Documentation
  • Grafana Labs blog
  • Webinars and videos
  • Tutorials
  • Workshops
  • Events
  • Community
  • Professional Services
  • Community forums
  • Community Slack
  • Grafana Champions
  • Community organizers
  • Observability Survey Report 2025
  • OSS vs Cloud
  • Writers' Toolkit
  • Plugin development
  • Load testing
  • OpenTelemetry Report
  • Log monitoring
Company
  • Partnerships
  • Our team
  • Careers
  • Success stories
  • Newsroom
  • Contact us
  • Getting help
  • Merch
  • Open positions We're hiring
  • The Story of Grafana
Compare
  • Grafana vs. Datadog
Localized content
  • Japanese pages
  • German pages
  • French pages
  • Spanish pages
  • Portuguese pages

  • Grafana Cloud status
  • Legal and Security
  • Terms of Service
  • Privacy Policy
  • Trademark Policy
Copyright 2025 © Grafana Labs
Grafana Labs uses cookies for the normal operation of this website. Learn more.