• Products Open Source Solutions Learn Docs Pricing
  • Downloads Contact us Sign in
Create free account Contact us

Products

Grafana Cloud

Monitor, analyze, and act faster with AI-powered observability.

Grafana Cloud
Grafana Cloud overview

LGTM+ Stack

Grafana Cloud Logs

Logs

powered by Grafana Loki

Grafana

Grafana

for visualization

Grafana Cloud Traces

Traces

powered by Grafana Tempo

Grafana Cloud Metrics

Metrics

powered by Grafana Mimir and Prometheus

Key Capabilities

AI/ML

AI/ML insights

Identify anomalies and reduce toil

Grafana Cloud Asserts

Contextual root cause analysis

Automated anomaly correlation

Grafana SLO

SLO management

Create SLOs and error budget alerts

Grafana Alerting

Alerting

Trigger alerts from any data source

Plugins

Plugins

Connect Grafana to data sources, apps, and more

Observability Solutions

Application Observability

Application Observability

Monitor application performance

Infrastructure Observability

Infrastructure observability

Ensure infrastructure health and performance

Testing

Grafana Cloud k6

Performance testing

Powered by Grafana k6

Synthetic Monitoring

Synthetic Monitoring

powered by Grafana k6

IRM

Incident

Incident response

Routine task automation for incidents

OnCall

On-call management

Flexible on-call management

Open Source

Grafana Loki

Multi-tenant log aggregation system

Grafana

Query, visualize, and alert on data

Grafana Tempo

High-scale distributed tracing backend

Grafana Mimir

Scalable and performant metrics backend

Grafana Pyroscope

Scalable continuous profiling backend

Grafana Beyla

eBPF auto-instrumentation

Grafana Faro

Frontend application observability web SDK

Grafana Alloy

OpenTelemetry Collector distribution with Prometheus pipelines

Grafana k6

Load testing for engineering teams

Prometheus

Monitor Kubernetes and cloud native

OpenTelemetry

Instrument and collect telemetry data

Graphite

Scalable monitoring for time series data

All

Community resources

Dashboard templates

Try out and share prebuilt visualizations

Prometheus exporters

Get your metrics into Prometheus quickly

end-to-end solutions

Opinionated solutions that help you get there easier and faster

Kubernetes Monitoring

Get K8s health, performance, and cost monitoring from cluster to container

Application Observability

Monitor application performance

Frontend Observability

Gain real user monitoring insights

Incident Response & Management

Detect and respond to incidents with a simplified workflow

All monitoring and visualization solutions

monitor infrastructure

Out-of-the-box KPIs, dashboards, and alerts for observability

linux server logo
Linux
windows logo
Windows
docker logo
Docker
postgresql logo
Postgres
mysql logo
MySQL
aws logo
AWS
kafka logo
Kafka
jenkins logo
Jenkins
rabbitmq logo
RabbitMQ
mongodb logo
MongoDB
microsoft azure observability logo
Microsoft Azure
google cloud observability with grafana cloud logo
Google Cloud
All monitoring solutions

visualize any data

Instantly connect all your data sources to Grafana

mongodb logo
MongoDB
appdynamics logo
AppDynamics
oracle database logo
Oracle
gitlab logo
GitLab
jira logo
Jira
salesforce logo
Salesforce
splunk logo
Splunk
datadog logo
Datadog
new relic logo
New Relic
snowflake logo
Snowflake
All visualization solutions

Learn

Community and events

Events

Upcoming in-person and virtual events

ObservabilityCON 2025 (7-9 Oct)

Our flagship observability event

GrafanaCON 2025

Our annual OSS community conference

ObservabilityCON on the Road

Our observability conference on the road

Community

Join the Grafana community

Community forums

Ask the community for help

Resources

Blog

News, releases, cool stories, and more

Observability survey report 2025

Industry insights on the state of observability

Benefits of Observability

New research, reports, and insights

Success stories

By use case, product, and industry

How-to

Documentation

All the docs

Webinars and videos

Demos, webinars, and feature tours

Tutorials

Step-by-step guides

Workshops

Free, in-person or online

Learning Journeys

Expert guidance for mastering our platform

Professional Services

Expert guidance and training

Docs
Pricing

Help build the future of open source observability software Open positions

Check out the open source projects we support Downloads

Sign in

Grafana Cloud

Monitor, analyze, and act faster with AI-powered observability.

Grafana Cloud
Grafana Cloud overview

LGTM+ Stack

Grafana Cloud Logs

Logs

Grafana

Grafana

Grafana Cloud Traces

Traces

Grafana Cloud Metrics

Metrics

Key Capabilities

AI/ML

AI/ML insights

Grafana Cloud Asserts

Contextual root cause analysis

Grafana SLO

SLO management

Grafana Alerting

Alerting

Plugins

Plugins

Observability Solutions

Application Observability

Application Observability

Infrastructure Observability

Infrastructure observability

Testing

Grafana Cloud k6

Performance testing

Synthetic Monitoring

Synthetic Monitoring

IRM

Incident

Incident response

OnCall

On-call management

The actually useful free plan

Grafana Cloud Free Tier
check

10k series Prometheus metrics

check

50GB logs, 50GB traces, 50GB profiles

check

500VUk k6 testing

check

20+ Enterprise data source plugins

check

100+ pre-built solutions

Create account
Grafana Cloud Logs

Grafana Loki

Multi-tenant log aggregation system

Grafana

Grafana

Query, visualize, and alert on data

Grafana Cloud Traces

Grafana Tempo

High-scale distributed tracing backend

Grafana Cloud Metrics

Grafana Mimir

Scalable and performant metrics backend

Grafana Cloud Profiles

Grafana Pyroscope

Scalable continuous profiling backend

Grafana Beyla

eBPF auto-instrumentation

Grafana Faro

Grafana Faro

Frontend application observability web SDK

Grafana Alloy

Grafana Alloy

OpenTelemetry Collector distribution with Prometheus pipelines

Grafana Cloud k6

Grafana k6

Load testing for engineering teams

Prometheus

Prometheus

Monitor Kubernetes and cloud native

OpenTelemetry

OpenTelemetry

Instrument and collect telemetry data

Graphite

Graphite

Scalable monitoring for time series data

All

Community resources

Dashboard templates
Try out and share prebuilt visualizations
Prometheus exporters
Get your metrics into Prometheus quickly

end-to-end solutions

Opinionated solutions that help you get there easier and faster

Kubernetes Monitoring

Kubernetes Monitoring

Get K8s health, performance, and cost monitoring from cluster to container

Application Observability

Application Observability

Monitor application performance

Frontend Observability

Frontend Observability

Gain real user monitoring insights

Incident Response & Management

Incident Response & Management

Detect and respond to incidents with a simplified workflow

monitor infrastructure

Out-of-the-box KPIs, dashboards, and alerts for observability

linux server logo Linux
windows logo Windows
docker logo Docker
postgresql logo Postgres
mysql logo MySQL
aws logo AWS
kafka logo Kafka
jenkins logo Jenkins
rabbitmq logo RabbitMQ
mongodb logo MongoDB
microsoft azure observability logo Microsoft Azure
google cloud observability with grafana cloud logo Google Cloud

visualize any data

Instantly connect all your data sources to Grafana

mongodb logo MongoDB
appdynamics logo AppDynamics
oracle database logo Oracle
gitlab logo GitLab
jira logo Jira
salesforce logo Salesforce
splunk logo Splunk
datadog logo Datadog
new relic logo New Relic
snowflake logo Snowflake
All monitoring and visualization solutions

Community and events

Events

ObservabilityCON 2025 (7-9 Oct)

GrafanaCON 2025

ObservabilityCON on the Road

Community

Community forums

Resources

Blog

Observability survey report 2025

Benefits of Observability

Success stories

How-to

Documentation

Webinars and videos

Tutorials

Workshops

Learning Journeys

Professional Services

Featured webinar

Getting started with grafana LGTM stack

Getting started with managing your metrics, logs, and traces using Grafana

Learn how to unify, correlate, and visualize data with dashboards using Grafana.

Learn more →
Try using Grot AI Grot AI for this query ->
Blog
  • All
  • Community
  • Culture
  • Engineering
  • News
  • Release
Blog
  • All
  • Community
  • Culture
  • Engineering
  • News
  • Release
Tags

OpenTelemetry

View all tags
Shorten your feedback loop: Java observability with OpenTelemetry, Grafana Cloud, and Digma.ai

Ron Dover   ·   21 Jun 2024   ·   8 min read

Shorten your feedback loop: Java observability with OpenTelemetry, Grafana Cloud, and Digma.ai

Reduce the time it takes for a developer to become aware of a bug and its source once it's introduced.

OpenTelemetry
Grafana Cloud

Read more


Translate Datadog metrics into OTLP with the OpenTelemetry Collector and Grafana Alloy

Carrie Edwards   ·   18 Jun 2024   ·   5 min read

Translate Datadog metrics into OTLP with the OpenTelemetry Collector and Grafana Alloy

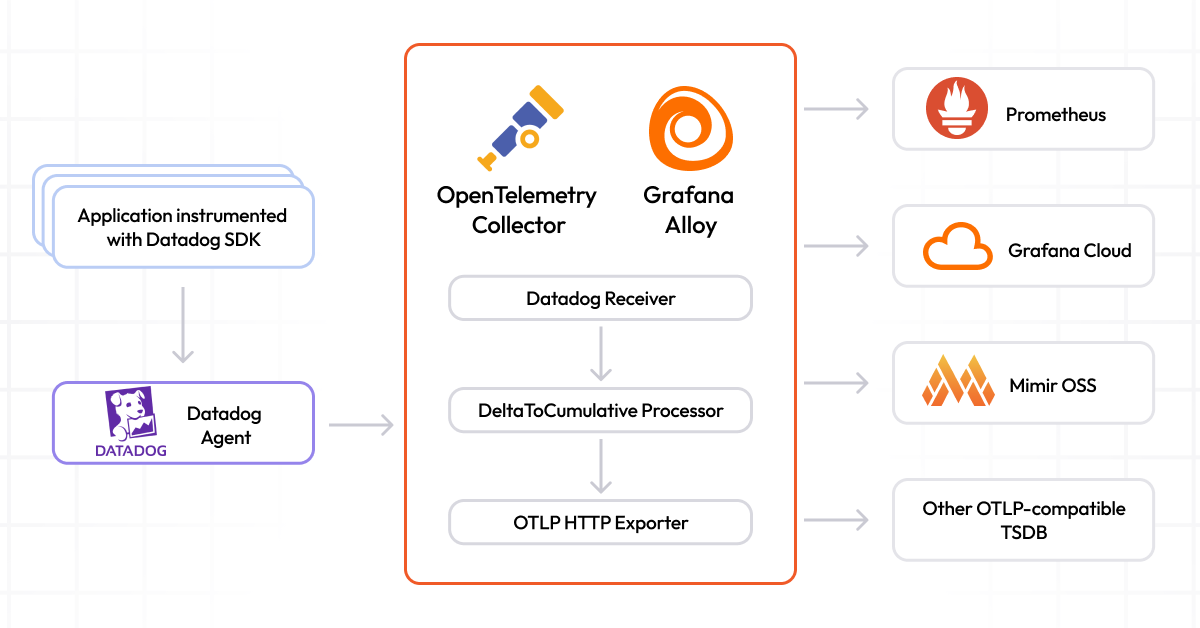
Today we are releasing new open source code for the OpenTelemetry Datadog receiver that allows users to translate Datadog metric formats into native...

OpenTelemetry
Prometheus
Mimir

Read more


How to use OpenTelemetry resource attributes and Grafana Cloud Application Observability to accelerate root cause analysis

Marylia Gutierrez   ·   17 Jun 2024   ·   9 min read

How to use OpenTelemetry resource attributes and Grafana Cloud Application Observability to...

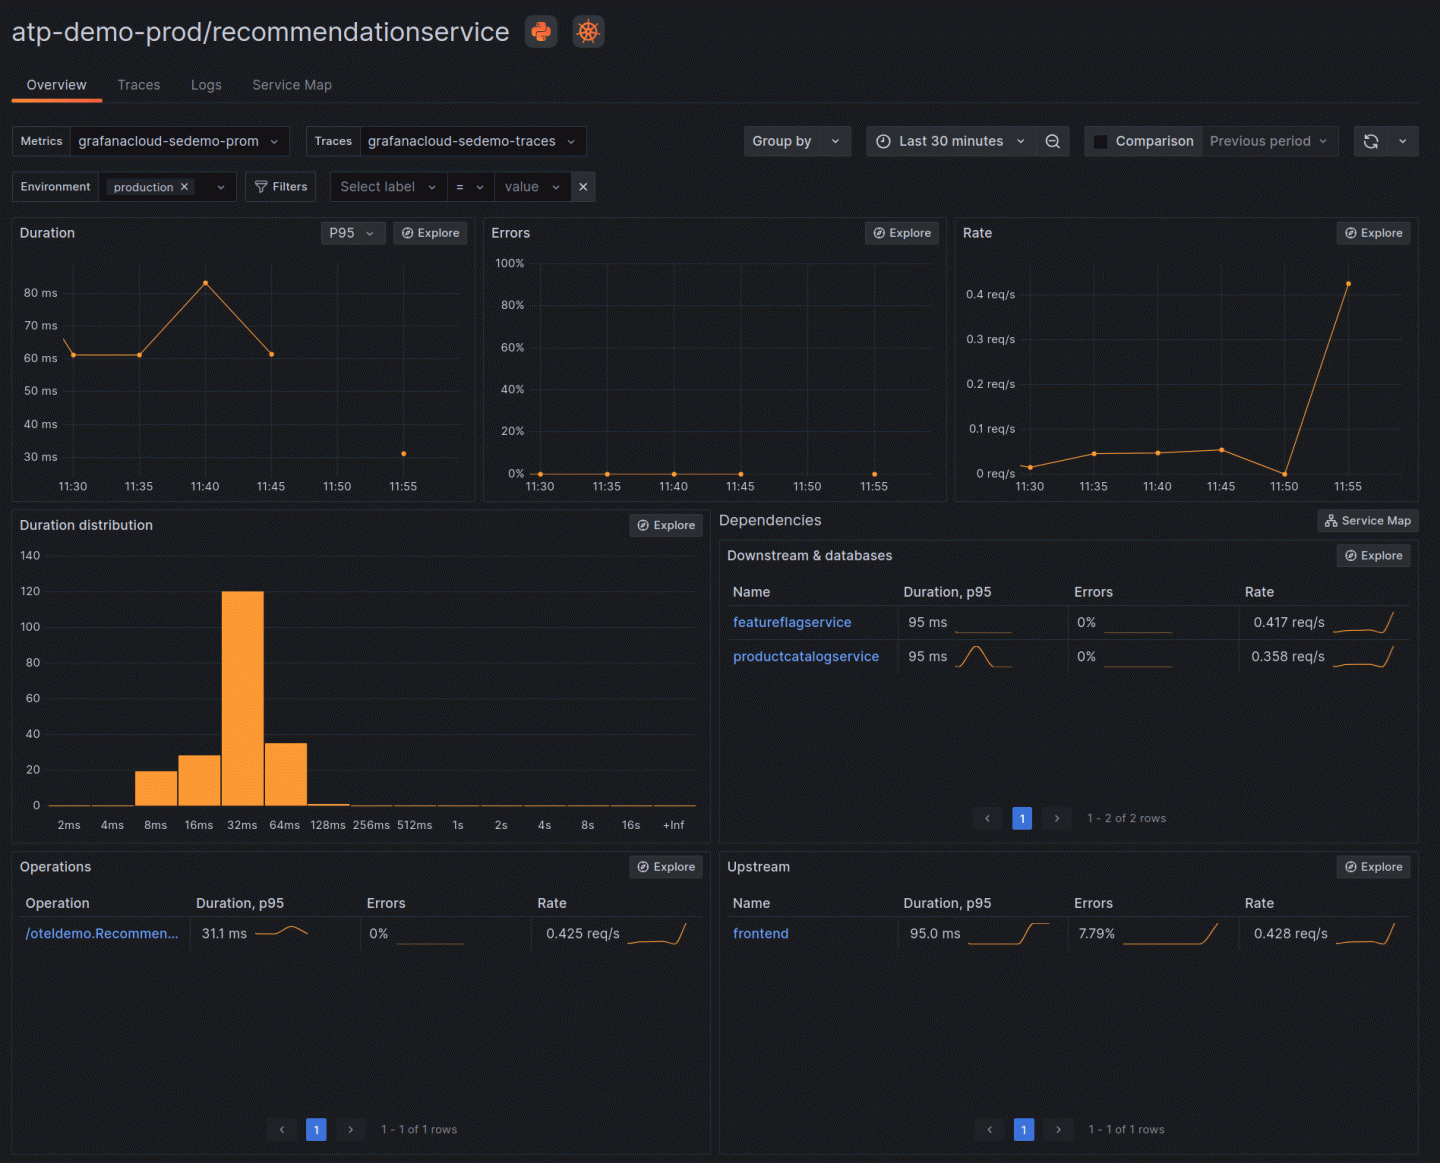
In this step-by-step post, learn how to collect OpenTelemetry resource attributes and analyze them in Grafana Cloud Application Observability to...

Application Observability
OpenTelemetry

Read more


Serverless observability: How to monitor Google Cloud Run with OpenTelemetry and Grafana Cloud

Kamel Djoudi   ·   23 May 2024   ·   13 min read

Serverless observability: How to monitor Google Cloud Run with OpenTelemetry and Grafana Cloud

Learn how to collect and analyze telemetry data from Google Cloud Run using OpenTelemetry and Application Observability in Grafana Cloud.

Application Observability
Grafana Cloud
OpenTelemetry

Read more


A guide to scaling OpenTelemetry Collectors across multiple hosts via Ansible

Ishan Jain   ·   18 Apr 2024   ·   5 min read

A guide to scaling OpenTelemetry Collectors across multiple hosts via Ansible

Learn how to scale your OpenTelemetry Collector deployment with Ansible to function as both gateways and agents within your observability...

Open source
OpenTelemetry
Monitoring

Read more


How ComplyAdvantage built a more flexible observability strategy with OpenTelemetry and Grafana Cloud

Joey Bartolomeo   ·   5 Apr 2024   ·   8 min read

How ComplyAdvantage built a more flexible observability strategy with OpenTelemetry and Grafana...

ComplyAdvantage has used OpenTelemetry and Grafana Cloud to continually advance its observability strategy and make it more flexible.

OpenTelemetry
Grafana Cloud
Observability

Read more


How the Prometheus community is investing in OpenTelemetry

Goutham Veeramachaneni   ·   3 Apr 2024   ·   5 min read

How the Prometheus community is investing in OpenTelemetry

The Prometheus community continues to deepen its commitment to the OpenTelemetry project. Here’s what’s in store for this year.

Prometheus
OpenTelemetry

Read more


OpenTelemetry distributed tracing with eBPF: What’s new in Grafana Beyla 1.3

Nikola Grcevski   ·   21 Mar 2024   ·   5 min read

OpenTelemetry distributed tracing with eBPF: What’s new in Grafana Beyla 1.3

Beyla 1.3 delivers OpenTelemetry distributed tracing support through two approaches: automatic header injection and black-box context propagation.

Grafana Beyla
OpenTelemetry
eBPF

Read more


An OpenTelemetry backend in a Docker image: Introducing grafana/otel-lgtm

Fabian Stäber   ·   13 Mar 2024   ·   9 min read

An OpenTelemetry backend in a Docker image: Introducing grafana/otel-lgtm

The grafana/otel-lgtm image is a great way to get started with open source monitoring with OpenTelemetry, as well as streamline integration testing.

Engineering

Read more


How to instrument your Python application using OpenTelemetry

Gregor Zeitlinger   ·   20 Feb 2024   ·   5 min read

How to instrument your Python application using OpenTelemetry

A complete guide for how to emit OpenTelemetry data from your Python application to Grafana Cloud.

OpenTelemetry
Application Observability

Read more


OpenTelemetry: 3 questions to ask before choosing an observability solution

Mark Covello   ·   16 Feb 2024   ·   5 min read

OpenTelemetry: 3 questions to ask before choosing an observability solution

When deciding where to host your OpenTelemetry data, be sure to ask these three important questions.

OpenTelemetry

Read more


OpenTelemetry and Grafana Labs: What’s new and what’s next

Juraci Paixão Kröhling   ·   31 Jan 2024   ·   6 min read

OpenTelemetry and Grafana Labs: What’s new and what’s next

The OpenTelemetry project hit a number of milestones last year — and that momentum will continue throughout 2024.

OpenTelemetry
Engineering

Read more


OpenTelemetry best practices: A user's guide to getting started with OpenTelemetry

Ashley Somerville   ·   18 Dec 2023   ·   11 min read

OpenTelemetry best practices: A user's guide to getting started with OpenTelemetry

A compilation of OpenTelemetry best practices based on commonly asked questions, frequent topics of discussion, and our own experiences at Grafana...

OpenTelemetry

Read more


Do you need an OpenTelemetry Collector?

David Allen   ·   21 Nov 2023   ·   7 min read

Do you need an OpenTelemetry Collector?

OpenTelemetry users often push logs, metrics, and traces to a collector before sending them to their backend. Find out why this is such a popular...

OpenTelemetry
Grafana
Grafana Agent

Read more


The Grafana OpenTelemetry Distribution for .NET: Optimized for Application Observability

Matthew Hensley   ·   16 Nov 2023   ·   6 min read

The Grafana OpenTelemetry Distribution for .NET: Optimized for Application Observability

We're all-in on OpenTelemetry at Grafana Labs, which is why we are excited to announce the public preview of the Grafana OpenTelemetry distribution...

Application Observability
OpenTelemetry

Read more


  • ««
  • «
  • 1
  • 2
  • 3
  • 4
  • »
  • »»
Sign up for Grafana stack updates
Note: By signing up, you agree to be emailed related product-level information.


Products
  • Grafana Cloud
  • Grafana Enterprise Stack
  • Grafana visualizations
  • Plugins
  • Grafana Cloud Logs
  • Grafana Cloud Metrics
  • Grafana Cloud Traces
  • Grafana Cloud Profiles
  • AI/ML tools for observability
  • Application Observability
  • Frontend Observability
  • Grafana Cloud Asserts
  • Grafana IRM
  • Grafana k6
  • Grafana SLO
  • Synthetic Monitoring
  • Solutions
  • Pricing
Open Source
  • Grafana
  • Grafana Alloy
  • Grafana Beyla
  • Grafana Faro
  • Grafana k6
  • Grafana Loki
  • Grafana Mimir
  • Grafana OnCall
  • Grafana Pyroscope
  • Grafana Tanka
  • Grafana Tempo
  • Graphite
  • OpenTelemetry
  • Prometheus
  • Dashboard templates
  • Downloads
  •   GitHub
Learn
  • Documentation
  • Grafana Labs blog
  • Webinars and videos
  • Tutorials
  • Workshops
  • Events
  • Community
  • Professional Services
  • Community forums
  • Community Slack
  • Grafana Champions
  • Community organizers
  • Observability Survey Report 2025
  • OSS vs Cloud
  • Writers' Toolkit
  • Plugin development
  • Load testing
  • OpenTelemetry Report
  • Log monitoring
Company
  • Partnerships
  • Our team
  • Careers
  • Success stories
  • Newsroom
  • Contact us
  • Getting help
  • Merch
  • Open positions We're hiring
  • The Story of Grafana
Compare
  • Grafana vs. Datadog
Localized content
  • Japanese pages
  • German pages
  • French pages
  • Spanish pages
  • Portuguese pages

  • Grafana Cloud status
  • Legal and Security
  • Terms of Service
  • Privacy Policy
  • Trademark Policy
Copyright 2025 © Grafana Labs
Grafana Labs uses cookies for the normal operation of this website. Learn more.