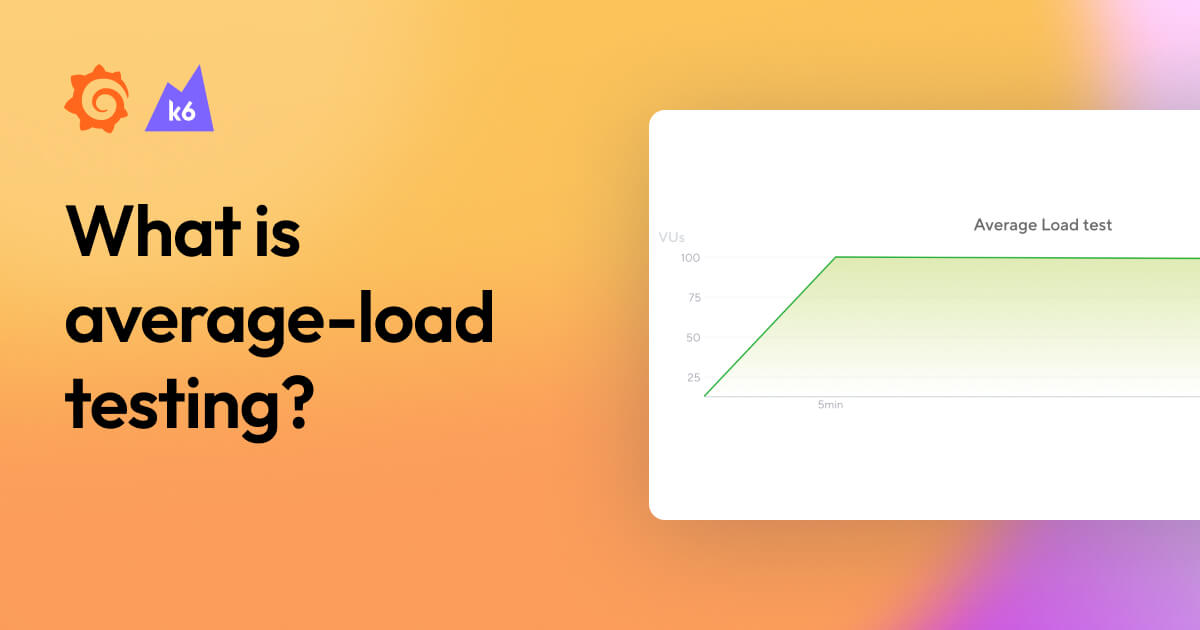
• Products Open Source Solutions Learn Docs Pricing
  • Downloads Contact us Sign in
Create free account Contact us

Products

Grafana Cloud

Monitor, analyze, and act faster with AI-powered observability.

Grafana Cloud
Grafana Cloud overview

LGTM+ Stack

Grafana Cloud Logs

Logs

powered by Grafana Loki

Grafana

Grafana

for visualization

Grafana Cloud Traces

Traces

powered by Grafana Tempo

Grafana Cloud Metrics

Metrics

powered by Grafana Mimir and Prometheus

Key Capabilities

AI/ML

AI/ML insights

Identify anomalies and reduce toil

Grafana Cloud Asserts

Contextual root cause analysis

Automated anomaly correlation

Grafana SLO

SLO management

Create SLOs and error budget alerts

Grafana Alerting

Alerting

Trigger alerts from any data source

Plugins

Plugins

Connect Grafana to data sources, apps, and more

Observability Solutions

Application Observability

Application Observability

Monitor application performance

Infrastructure Observability

Infrastructure observability

Ensure infrastructure health and performance

Testing

Grafana Cloud k6

Performance testing

Powered by Grafana k6

Synthetic Monitoring

Synthetic Monitoring

powered by Grafana k6

IRM

Incident

Incident response

Routine task automation for incidents

OnCall

On-call management

Flexible on-call management

Open Source

Grafana Loki

Multi-tenant log aggregation system

Grafana

Query, visualize, and alert on data

Grafana Tempo

High-scale distributed tracing backend

Grafana Mimir

Scalable and performant metrics backend

Grafana Pyroscope

Scalable continuous profiling backend

Grafana Beyla

eBPF auto-instrumentation

Grafana Faro

Frontend application observability web SDK

Grafana Alloy

OpenTelemetry Collector distribution with Prometheus pipelines

Grafana k6

Load testing for engineering teams

Prometheus

Monitor Kubernetes and cloud native

OpenTelemetry

Instrument and collect telemetry data

Graphite

Scalable monitoring for time series data

All

Community resources

Dashboard templates

Try out and share prebuilt visualizations

Prometheus exporters

Get your metrics into Prometheus quickly

end-to-end solutions

Opinionated solutions that help you get there easier and faster

Kubernetes Monitoring

Get K8s health, performance, and cost monitoring from cluster to container

Application Observability

Monitor application performance

Frontend Observability

Gain real user monitoring insights

Incident Response & Management

Detect and respond to incidents with a simplified workflow

All monitoring and visualization solutions

monitor infrastructure

Out-of-the-box KPIs, dashboards, and alerts for observability

linux server logo
Linux
windows logo
Windows
docker logo
Docker
postgresql logo
Postgres
mysql logo
MySQL
aws logo
AWS
kafka logo
Kafka
jenkins logo
Jenkins
rabbitmq logo
RabbitMQ
mongodb logo
MongoDB
microsoft azure observability logo
Microsoft Azure
google cloud observability with grafana cloud logo
Google Cloud
All monitoring solutions

visualize any data

Instantly connect all your data sources to Grafana

mongodb logo
MongoDB
appdynamics logo
AppDynamics
oracle database logo
Oracle
gitlab logo
GitLab
jira logo
Jira
salesforce logo
Salesforce
splunk logo
Splunk
datadog logo
Datadog
new relic logo
New Relic
snowflake logo
Snowflake
All visualization solutions

Learn

Community and events

Events

Upcoming in-person and virtual events

ObservabilityCON 2025 (7-9 Oct)

Our flagship observability event

GrafanaCON 2025

Our annual OSS community conference

ObservabilityCON on the Road

Our observability conference on the road

Community

Join the Grafana community

Community forums

Ask the community for help

Resources

Blog

News, releases, cool stories, and more

4th annual Observability Survey

Share your thoughts on the state of observability

Benefits of Observability

New research, reports, and insights

Success stories

By use case, product, and industry

How-to

Documentation

All the docs

Webinars and videos

Demos, webinars, and feature tours

Tutorials

Step-by-step guides

Workshops

Free, in-person or online

Learning Journeys

Expert guidance for mastering our platform

Professional Services

Expert guidance and training

Docs
Pricing

Help build the future of open source observability software Open positions

Check out the open source projects we support Downloads

Sign in

Grafana Cloud

Monitor, analyze, and act faster with AI-powered observability.

Grafana Cloud
Grafana Cloud overview

LGTM+ Stack

Grafana Cloud Logs

Logs

Grafana

Grafana

Grafana Cloud Traces

Traces

Grafana Cloud Metrics

Metrics

Key Capabilities

AI/ML

AI/ML insights

Grafana Cloud Asserts

Contextual root cause analysis

Grafana SLO

SLO management

Grafana Alerting

Alerting

Plugins

Plugins

Observability Solutions

Application Observability

Application Observability

Infrastructure Observability

Infrastructure observability

Testing

Grafana Cloud k6

Performance testing

Synthetic Monitoring

Synthetic Monitoring

IRM

Incident

Incident response

OnCall

On-call management

The actually useful free plan

Grafana Cloud Free Tier
check

10k series Prometheus metrics

check

50GB logs, 50GB traces, 50GB profiles

check

500VUk k6 testing

check

20+ Enterprise data source plugins

check

100+ pre-built solutions

Create account
Grafana Cloud Logs

Grafana Loki

Multi-tenant log aggregation system

Grafana

Grafana

Query, visualize, and alert on data

Grafana Cloud Traces

Grafana Tempo

High-scale distributed tracing backend

Grafana Cloud Metrics

Grafana Mimir

Scalable and performant metrics backend

Grafana Cloud Profiles

Grafana Pyroscope

Scalable continuous profiling backend

Grafana Beyla

eBPF auto-instrumentation

Grafana Faro

Grafana Faro

Frontend application observability web SDK

Grafana Alloy

Grafana Alloy

OpenTelemetry Collector distribution with Prometheus pipelines

Grafana Cloud k6

Grafana k6

Load testing for engineering teams

Prometheus

Prometheus

Monitor Kubernetes and cloud native

OpenTelemetry

OpenTelemetry

Instrument and collect telemetry data

Graphite

Graphite

Scalable monitoring for time series data

All

Community resources

Dashboard templates
Try out and share prebuilt visualizations
Prometheus exporters
Get your metrics into Prometheus quickly

end-to-end solutions

Opinionated solutions that help you get there easier and faster

Kubernetes Monitoring

Kubernetes Monitoring

Get K8s health, performance, and cost monitoring from cluster to container

Application Observability

Application Observability

Monitor application performance

Frontend Observability

Frontend Observability

Gain real user monitoring insights

Incident Response & Management

Incident Response & Management

Detect and respond to incidents with a simplified workflow

monitor infrastructure

Out-of-the-box KPIs, dashboards, and alerts for observability

linux server logo Linux
windows logo Windows
docker logo Docker
postgresql logo Postgres
mysql logo MySQL
aws logo AWS
kafka logo Kafka
jenkins logo Jenkins
rabbitmq logo RabbitMQ
mongodb logo MongoDB
microsoft azure observability logo Microsoft Azure
google cloud observability with grafana cloud logo Google Cloud

visualize any data

Instantly connect all your data sources to Grafana

mongodb logo MongoDB
appdynamics logo AppDynamics
oracle database logo Oracle
gitlab logo GitLab
jira logo Jira
salesforce logo Salesforce
splunk logo Splunk
datadog logo Datadog
new relic logo New Relic
snowflake logo Snowflake
All monitoring and visualization solutions

Community and events

Events

ObservabilityCON 2025 (7-9 Oct)

GrafanaCON 2025

ObservabilityCON on the Road

Community

Community forums

Resources

Blog

4th annual Observability Survey

Benefits of Observability

Success stories

How-to

Documentation

Webinars and videos

Tutorials

Workshops

Learning Journeys

Professional Services

Featured webinar

Getting started with grafana LGTM stack

Getting started with managing your metrics, logs, and traces using Grafana

Learn how to unify, correlate, and visualize data with dashboards using Grafana.

Learn more →
Try using Grot AI Grot AI for this query ->
Blog
  • All
  • Community
  • Culture
  • Engineering
  • News
  • Release
Blog
  • All
  • Community
  • Culture
  • Engineering
  • News
  • Release
Tags

k6

View all tags
Breakpoint testing: A beginner's guide

Grafana Labs Team   ·   30 Jan 2024   ·   5 min read

Breakpoint testing: A beginner's guide

Learn how a breakpoint test identifies where and how a system starts to fail and helps you prepare for those limits.

k6
Load testing
Performance testing

Read more


How to load test a website: A comprehensive guide

Grafana Labs Team   ·   30 Jan 2024   ·   16 min read

How to load test a website: A comprehensive guide

In this guide, learn about strategies to test websites, including specific recommendations for complex scenario scripting and test execution.

k6
Load testing
Performance testing

Read more


Load testing tools: Open source considerations for homegrown solutions

Grafana Labs Team   ·   30 Jan 2024   ·   10 min read

Load testing tools: Open source considerations for homegrown solutions

Learn what to look for in an open source load testing tool, as well what to do when you've outgrown your homegrown solution.

k6
Load testing
Performance testing

Read more


Smoke testing: A beginner's guide

Grafana Labs Team   ·   30 Jan 2024   ·   3 min read

Smoke testing: A beginner's guide

A basic guide to smoke testing and how to set up a smoke test in Grafana k6

k6
Load testing
Performance testing

Read more


Soak testing: A beginner's guide

Grafana Labs Team   ·   30 Jan 2024   ·   4 min read

Soak testing: A beginner's guide

A basic guide to soak testing and how to perform a soak test in Grafana k6

k6
Load testing
Performance testing

Read more


Spike testing: A beginner's guide

Grafana Labs Team   ·   30 Jan 2024   ·   4 min read

Spike testing: A beginner's guide

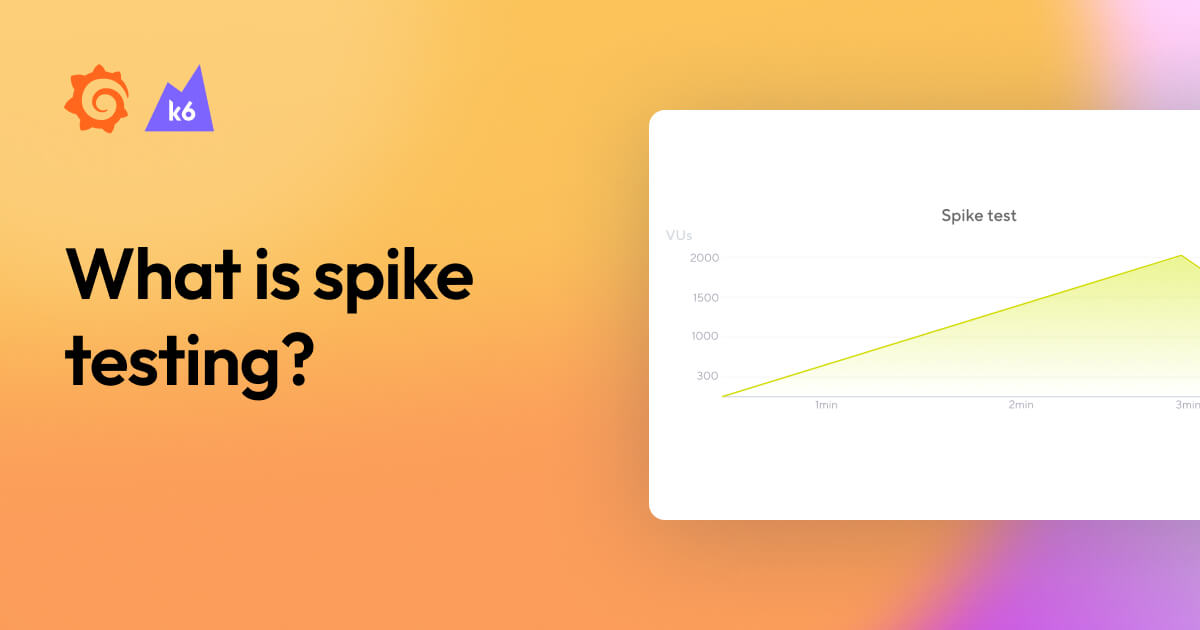
Can your system survive a sudden and massive surge in traffic? A spike test can give you the answer.

k6
Load testing
Performance testing

Read more


Stress testing: A beginner's guide

Grafana Labs Team   ·   30 Jan 2024   ·   4 min read

Stress testing: A beginner's guide

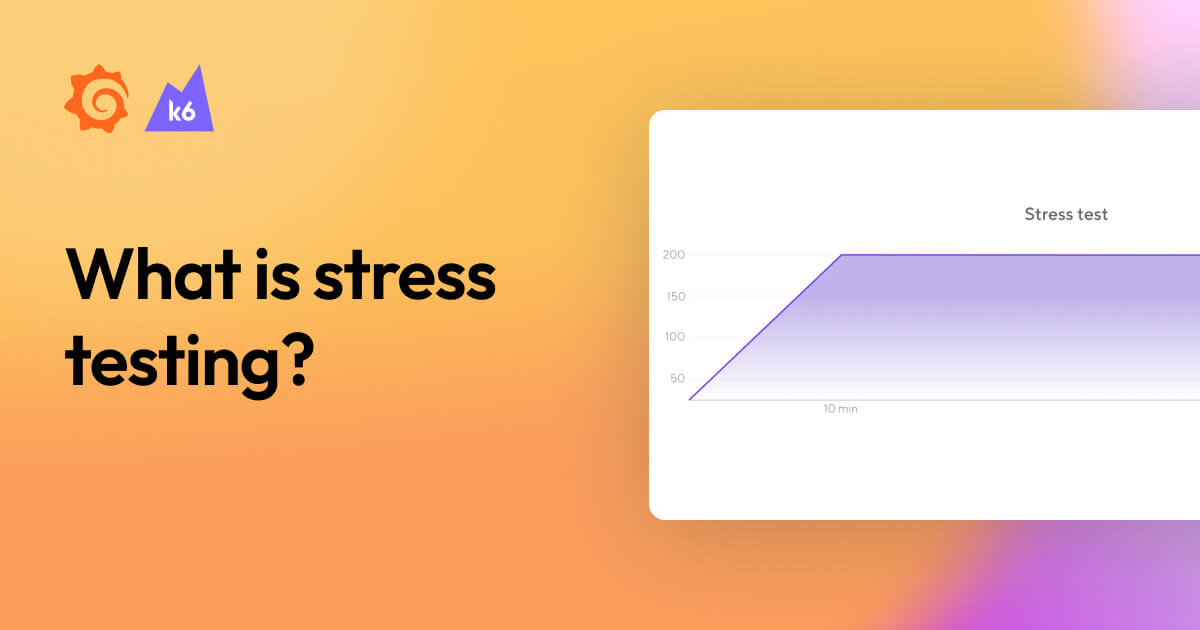
A basic guide to stress testing and how to create a stress test in Grafana k6

k6
Load testing
Performance testing

Read more


New in Grafana k6: The latest OSS features in v0.47.0 and more efficient performance testing in Grafana Cloud k6

Wei Li   ·   19 Oct 2023   ·   9 min read

New in Grafana k6: The latest OSS features in v0.47.0 and more efficient performance testing in...

Grafana k6 v0.47.0 is here, introducing binary metadata support in the k6 gRPC module, Docker images for ARM64 architecture, and other exciting new...

k6
Engineering

Read more


Better anomaly detection in system observability and performance testing with Grafana k6

Grzegorz Piechnik   ·   25 Sep 2023   ·   9 min read

Better anomaly detection in system observability and performance testing with Grafana k6

The xk6-anomaly extension makes the analysis of test results faster and more precise, improves the efficiency of problem detection, and simply saves...

k6

Read more


Grafana k6 v0.46.0 release:  TLS per gRPC connection support, new usage reports in Grafana Cloud k6, and more!

Wei Li   ·   24 Aug 2023   ·   8 min read

Grafana k6 v0.46.0 release: TLS per gRPC connection support, new usage reports in Grafana Cloud k6,...

Grafana k6 v0.46.0 introduces a number of exciting new capabilities, including usage reports and the ability to send custom headers to Loki log...

Engineering
k6
Release

Read more


Reduce MTTR with Grafana, Grafana k6, and Prometheus: Inside DHL’s observability stack

Lauren Johnson   ·   16 Aug 2023   ·   5 min read

Reduce MTTR with Grafana, Grafana k6, and Prometheus: Inside DHL’s observability stack

Find out how DHL Switzerland radically transformed their stack to reduce MTTR and make a smooth migration to the public cloud.

Community
k6
Prometheus
Grafana
GrafanaCon

Read more


Understanding Grafana k6: A simple guide to the load testing tool

Théo Crevon   ·   10 Aug 2023   ·   5 min read

Understanding Grafana k6: A simple guide to the load testing tool

To unlock the full potential of Grafana k6, it’s important to first understand the key features and underlying design of the open source load testing...

k6

Read more


How to fix performance issues using k6 and the Grafana LGTM Stack

Dominik Süß   ·   5 Jul 2023   ·   8 min read

How to fix performance issues using k6 and the Grafana LGTM Stack

k6
Loki
Grafana
Tempo
Mimir

Read more


Grafana k6 v0.45.0 release:  gRPC streaming support, cloud script updates without running tests and more!

Wei Li   ·   27 Jun 2023   ·   6 min read

Grafana k6 v0.45.0 release: gRPC streaming support, cloud script updates without running tests and...

k6

Read more


Grafana k6 v0.44.0 release: web crypto API, Web Vitals metrics, and more!

Grafana Labs Team   ·   27 Apr 2023   ·   6 min read

Grafana k6 v0.44.0 release: web crypto API, Web Vitals metrics, and more!

Grafana Cloud
k6

Read more


  • ««
  • «
  • 1
  • 2
  • 3
  • 4
  • 5
  • »
  • »»
Sign up for Grafana stack updates
Note: By signing up, you agree to be emailed related product-level information.


Products
  • Grafana Cloud
  • Grafana Enterprise Stack
  • Grafana visualizations
  • Plugins
  • Grafana Cloud Logs
  • Grafana Cloud Metrics
  • Grafana Cloud Traces
  • Grafana Cloud Profiles
  • AI/ML tools for observability
  • Application Observability
  • Frontend Observability
  • Grafana Cloud Asserts
  • Grafana IRM
  • Grafana k6
  • Grafana SLO
  • Synthetic Monitoring
  • Solutions
  • Pricing
Open Source
  • Grafana
  • Grafana Alloy
  • Grafana Beyla
  • Grafana Faro
  • Grafana k6
  • Grafana Loki
  • Grafana Mimir
  • Grafana OnCall
  • Grafana Pyroscope
  • Grafana Tanka
  • Grafana Tempo
  • Graphite
  • OpenTelemetry
  • Prometheus
  • Dashboard templates
  • Downloads
  •   GitHub
Learn
  • Documentation
  • Grafana Labs blog
  • Webinars and videos
  • Tutorials
  • Workshops
  • Events
  • Community
  • Professional Services
  • Community forums
  • Community Slack
  • Grafana Champions
  • Community organizers
  • Observability Survey Report 2025
  • OSS vs Cloud
  • Writers' Toolkit
  • Plugin development
  • Load testing
  • OpenTelemetry Report
  • Log monitoring
Company
  • Partnerships
  • Our team
  • Careers
  • Success stories
  • Newsroom
  • Contact us
  • Getting help
  • Merch
  • Open positions We're hiring
  • The Story of Grafana
Compare
  • Grafana vs. Datadog
Localized content
  • Japanese pages
  • German pages
  • French pages
  • Spanish pages
  • Portuguese pages

  • Grafana Cloud status
  • Legal and Security
  • Terms of Service
  • Privacy Policy
  • Trademark Policy
Copyright 2025 © Grafana Labs
Grafana Labs uses cookies for the normal operation of this website. Learn more.