How to monitor Oracle Database with Grafana Cloud
Read more
Products
LGTM+ Stack
Key Capabilities
Observability Solutions
Deploy The Stack
Open Source
Community resources
Dashboard templates
Try out and share prebuilt visualizations
Prometheus exporters
Get your metrics into Prometheus quickly
end-to-end solutions
Opinionated solutions that help you get there easier and faster
monitor infrastructure
Out-of-the-box KPIs, dashboards, and alerts for observability
visualize any data
Instantly connect all your data sources to Grafana
Learn
Stay up to date
Technical learning
Docs
Get started
Get started with Grafana
Build your first dashboard
Get started with Grafana Cloud
What's new / Release notes
Help build the future of open source observability software Open positions
Check out the open source projects we support Downloads
Deploy The Stack
end-to-end solutions
Opinionated solutions that help you get there easier and faster
visualize any data
Instantly connect all your data sources to Grafana
Emily Rager · 10 May 2023 · 4 min read
Read more
Gabriel Antunes · 11 Apr 2023 · 4 min read
Read more
Gloria Semme · 10 Apr 2023 · 6 min read
Read more
Emily Rager · 17 Nov 2022 · 6 min read
Read more
Muhammad Shahzeb · 7 Nov 2022 · 3 min read
Read more
Muhammad Shahzeb · 3 Oct 2022 · 3 min read
Read more
Muhammad Shahzeb · 10 Aug 2022 · 3 min read
Read more
Vitaly Zhuravlev · 23 May 2022 · 3 min read
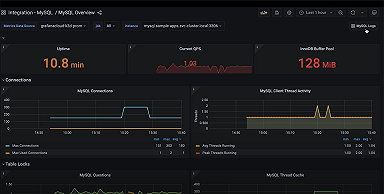
The updated MySQL integration for Grafana Cloud now includes a new pre-built MySQL logs dashboard and the Grafana Agent configuration to view and...
Read more
Vitaly Zhuravlev · 20 May 2022 · 2 min read
With the macOS integration, you can start your Grafana Cloud observability journey from your very own laptop.
Read more
Gabriel Antunes · 17 May 2022 · 2 min read
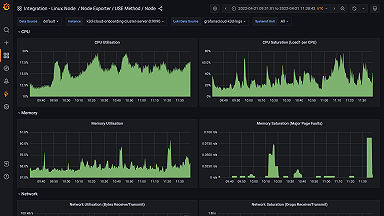
The Linux Node integration for Grafana Cloud now includes logs with Grafana Loki and a new USE method dashboard.
Read more
Muhammad Shahzeb · 4 May 2022 · 4 min read
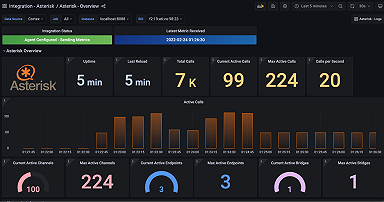
The new Asterisk integration for Grafana Cloud allows you to easily monitor an Asterisk system by following a few simple steps.
Read more
Matthew Nolf · 27 Apr 2022 · 4 min read
The fully managed Confluent Cloud integration makes it simple to monitor and visualize your Confluent Cloud resources in Grafana.
Read more
Hanif Jetha · 25 Apr 2022 · 6 min read
The latest features in the Kubernetes integration for Grafana Cloud support Kubernetes events, allow for collecting and shipping container logs,...
Read more
Vitaly Zhuravlev · 17 Mar 2022 · 2 min read
Read more
Gabriel Antunes · 9 Mar 2022 · 3 min read
The Apache Spark integration for Grafana Cloud provides a pre-built dashboard to unify data around Worker Nodes and related jobs in your Apache Spark...
Read more
Register today! Explore sessions covering OpenTelemetry, Prometheus, & Loki, discover Grafana 12's latest features, and more.
RegisterAfter last year's record sellout, our biggest community event is headed to Seattle on May 6-8! Discover what's new in Grafana 12, learn from 20+ talks covering Prometheus, OpenTelemetry, & Loki, and much more.
No credit card needed, ever.
Become a Champion
Helping others embodies the spirit of open source, and we want to celebrate your invaluable contributions.
Become a ChampionGolden Grots
Helping others embodies the spirit of open source, and we want to celebrate your invaluable contributions.
Submit your dashboardBecome a Contributor
Helping others embodies the spirit of open source, and we want to celebrate your invaluable contributions.
Gain insight into unused metrics and optimize metric cardinality with the new cardinality management dashboards and Adaptive Metrics