AWS Observability in Grafana Cloud: A simpler, more intuitive cloud monitoring app
Introducing AWS Observability, a user-centric app in Grafana Cloud that makes it easier than ever to monitor AWS for a diverse range of projects.
Read more
Products
Grafana Cloud
Monitor, analyze, and act faster with AI-powered observability.
LGTM+ Stack
Key Capabilities
Observability Solutions
end-to-end solutions
Opinionated solutions that help you get there easier and faster
monitor infrastructure
Out-of-the-box KPIs, dashboards, and alerts for observability
visualize any data
Instantly connect all your data sources to Grafana
Grafana Cloud
Monitor, analyze, and act faster with AI-powered observability.
The actually useful free plan
10k series Prometheus metrics
50GB logs, 50GB traces, 50GB profiles
500VUk k6 testing
20+ Enterprise data source plugins
100+ pre-built solutions
Opinionated solutions that help you get there easier and faster
Instantly connect all your data sources to Grafana
Getting started with managing your metrics, logs, and traces using Grafana
Learn how to unify, correlate, and visualize data with dashboards using Grafana.
Introducing AWS Observability, a user-centric app in Grafana Cloud that makes it easier than ever to monitor AWS for a diverse range of projects.
Read more
Learn how to use the new SurrealDB data source plugin to visualize data from this multimodal database directly in Grafana.
Read more
Learn how to monitor Rocky Linux, a RHEL-compatible open source operating system, using the Linux integration in Grafana Cloud.
Read more
Take your AWS observability to the next level with Grafana Cloud. We now offer an EC2 solution that makes it easier than ever to monitor your AWS...
Read more
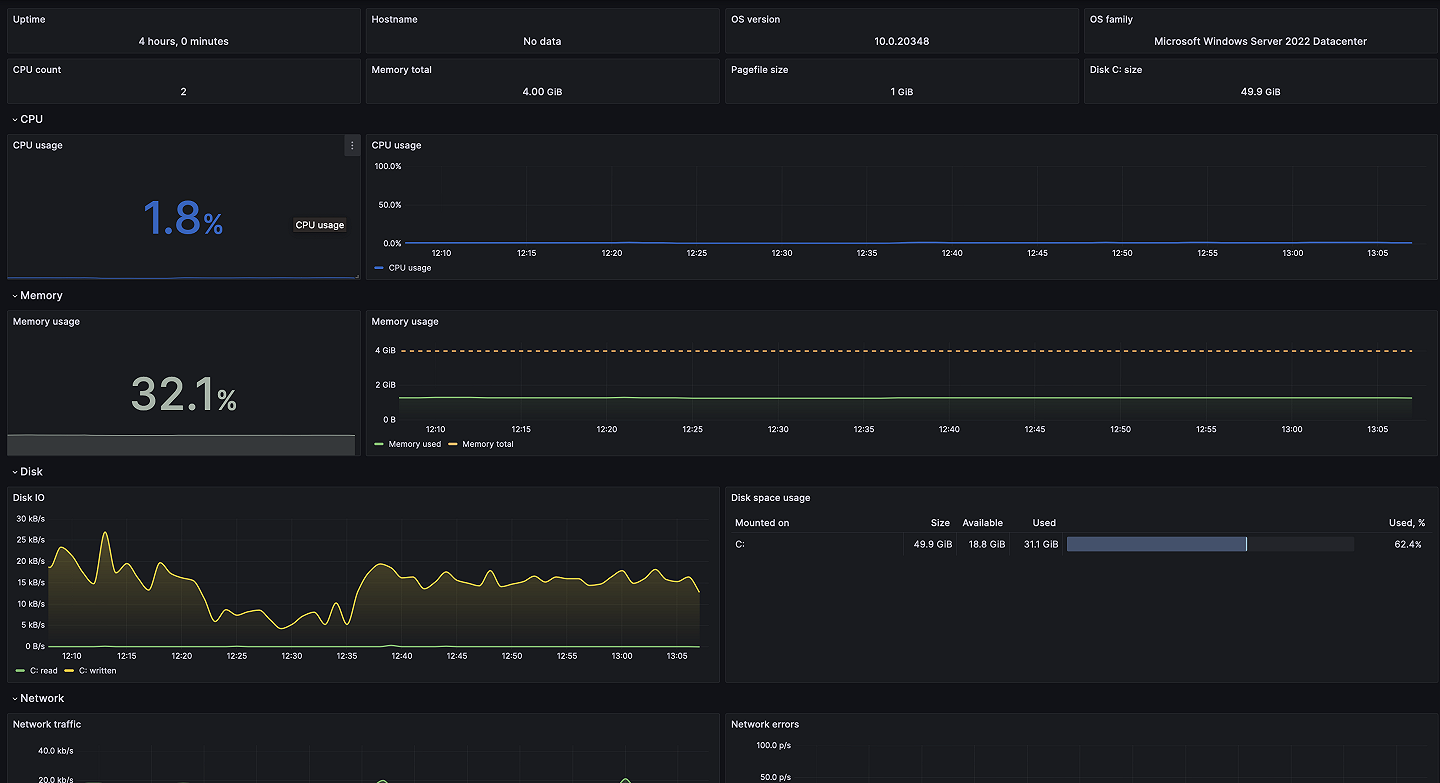
We've released a major update for Windows, our most popular integration. Use new dashboards, alerts, and annotations for nodes and fleets — all with...
Read more
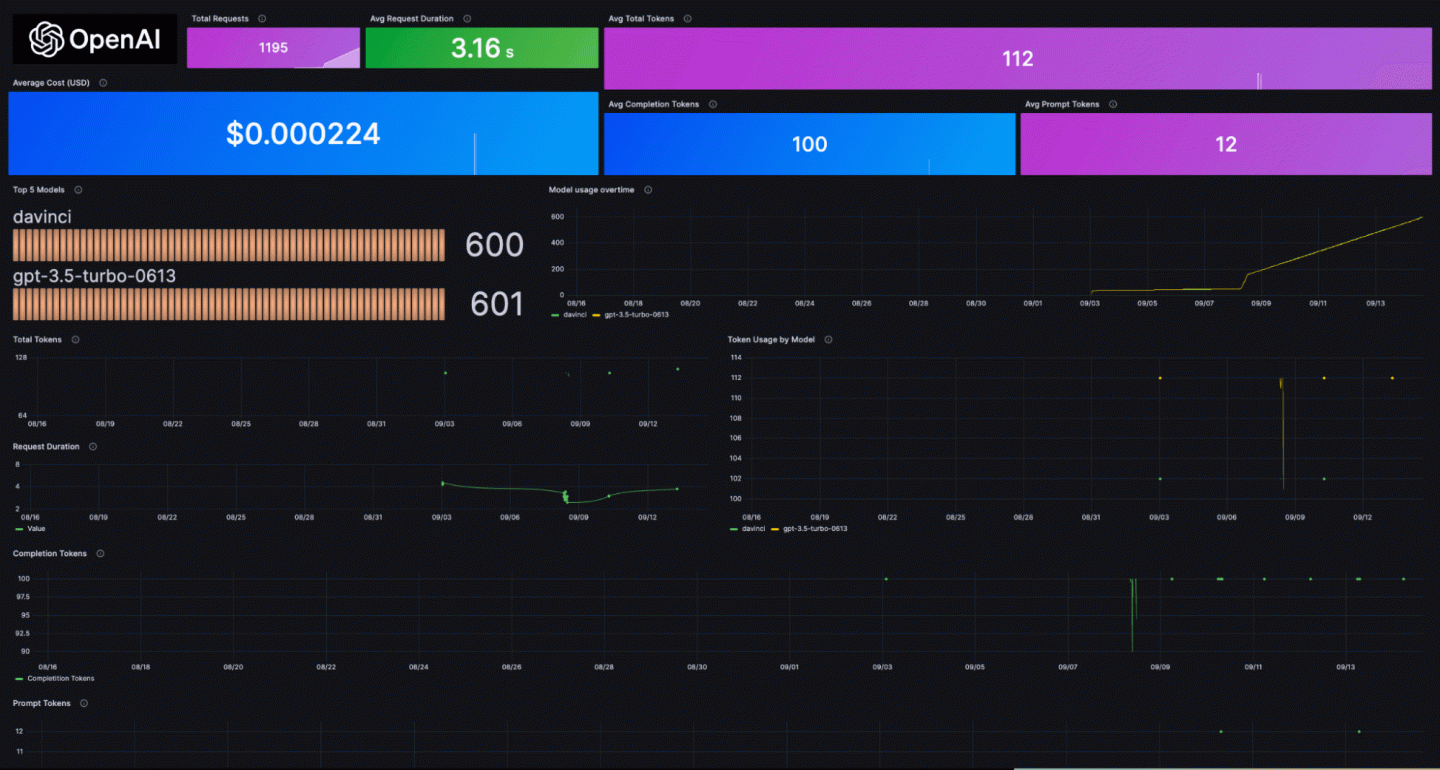
Monitoring OpenAI usage can help control costs, optimize resources, identify models, and more. Learn how to easily get started using Grafana Cloud's...
Read more
There are lots of ways to embed Grafana dashboards into other web apps, but the number of choices can also lead to confusion. Learn about the...
Read more
The Metrics Endpoint solution is an agentless integration you can use to forward Prometheus metrics from your publicly addressable host directly into...
Read more
Combine feature management with observability data to gain a deeper level of visibility into their release processes with this new integration between...
Read more
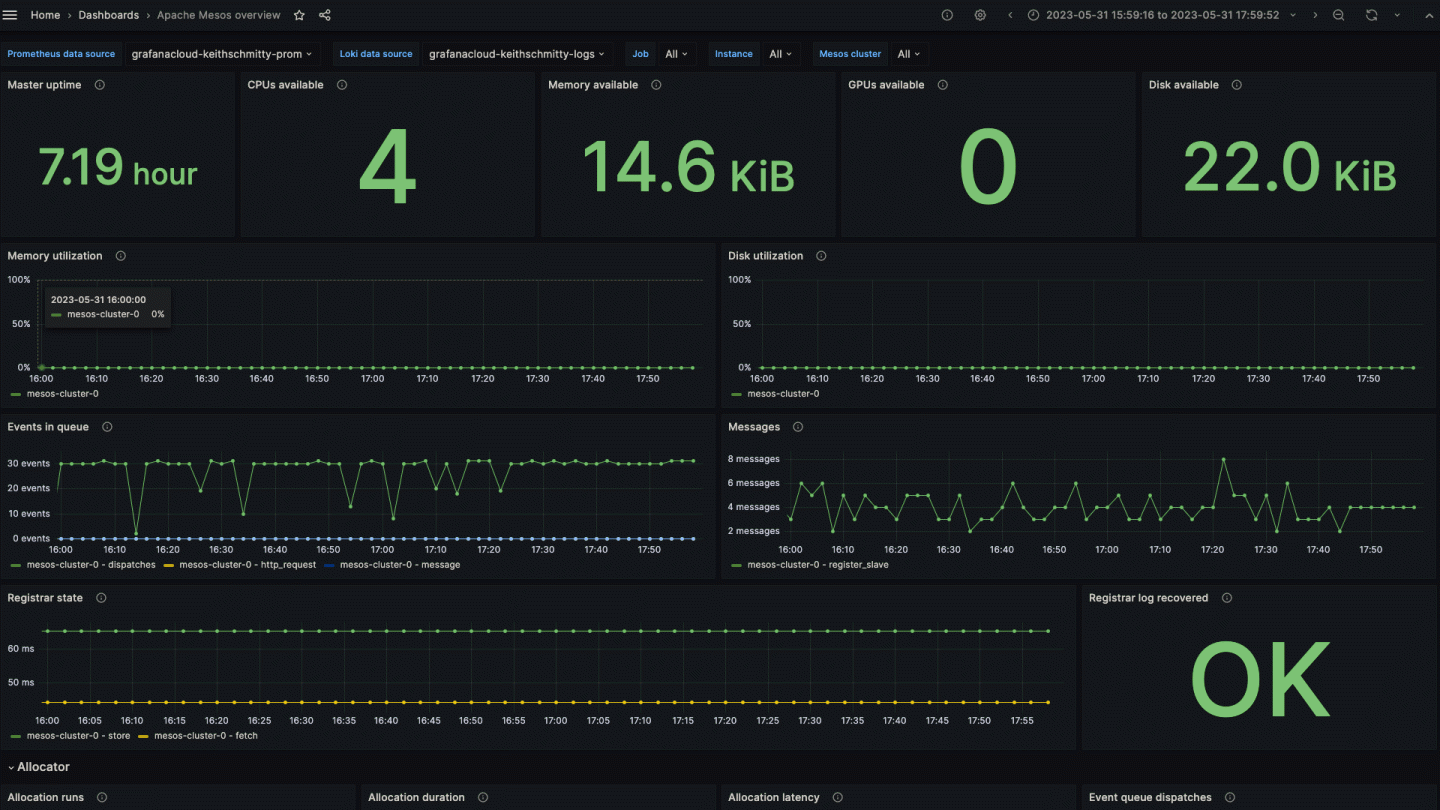
With the new Grafana Cloud solution for Apache Mesos you can easily monitor your Apache Mesos clusters by following a few simple steps.
Read more
Read more
Read more
Whether it's for compliance purposes or to analyze past incidents, use Grafana Cloud Logs Exporter to transfer your logs — for free! — to your own...
Read more
Read more
Read more