• Products Open Source Solutions Learn Docs Pricing
  • Downloads Contact us Sign in
Create free account Contact us

Products

Grafana Cloud

Monitor, analyze, and act faster with AI-powered observability.

Grafana Cloud
Grafana Cloud overview

LGTM+ Stack

Grafana Cloud Logs

Logs

powered by Grafana Loki

Grafana

Grafana

for visualization

Grafana Cloud Traces

Traces

powered by Grafana Tempo

Grafana Cloud Metrics

Metrics

powered by Grafana Mimir and Prometheus

Key Capabilities

AI/ML

AI/ML insights

Identify anomalies and reduce toil

Grafana Cloud Asserts

Contextual root cause analysis

Automated anomaly correlation

Grafana SLO

SLO management

Create SLOs and error budget alerts

Grafana Alerting

Alerting

Trigger alerts from any data source

Plugins

Plugins

Connect Grafana to data sources, apps, and more

Observability Solutions

Application Observability

Application Observability

Monitor application performance

Infrastructure Observability

Infrastructure observability

Ensure infrastructure health and performance

Testing

Grafana Cloud k6

Performance testing

Powered by Grafana k6

Synthetic Monitoring

Synthetic Monitoring

powered by Grafana k6

IRM

Incident

Incident response

Routine task automation for incidents

OnCall

On-call management

Flexible on-call management

Open Source

Grafana Loki

Multi-tenant log aggregation system

Grafana

Query, visualize, and alert on data

Grafana Tempo

High-scale distributed tracing backend

Grafana Mimir

Scalable and performant metrics backend

Grafana Pyroscope

Scalable continuous profiling backend

Grafana Beyla

eBPF auto-instrumentation

Grafana Faro

Frontend application observability web SDK

Grafana Alloy

OpenTelemetry Collector distribution with Prometheus pipelines

Grafana k6

Load testing for engineering teams

Prometheus

Monitor Kubernetes and cloud native

OpenTelemetry

Instrument and collect telemetry data

Graphite

Scalable monitoring for time series data

All

Community resources

Dashboard templates

Try out and share prebuilt visualizations

Prometheus exporters

Get your metrics into Prometheus quickly

end-to-end solutions

Opinionated solutions that help you get there easier and faster

Kubernetes Monitoring

Get K8s health, performance, and cost monitoring from cluster to container

Application Observability

Monitor application performance

Frontend Observability

Gain real user monitoring insights

Incident Response & Management

Detect and respond to incidents with a simplified workflow

All monitoring and visualization solutions

monitor infrastructure

Out-of-the-box KPIs, dashboards, and alerts for observability

linux server logo
Linux
windows logo
Windows
docker logo
Docker
postgresql logo
Postgres
mysql logo
MySQL
aws logo
AWS
kafka logo
Kafka
jenkins logo
Jenkins
rabbitmq logo
RabbitMQ
mongodb logo
MongoDB
microsoft azure observability logo
Microsoft Azure
google cloud observability with grafana cloud logo
Google Cloud
All monitoring solutions

visualize any data

Instantly connect all your data sources to Grafana

mongodb logo
MongoDB
appdynamics logo
AppDynamics
oracle database logo
Oracle
gitlab logo
GitLab
jira logo
Jira
salesforce logo
Salesforce
splunk logo
Splunk
datadog logo
Datadog
new relic logo
New Relic
snowflake logo
Snowflake
All visualization solutions

Learn

Community and events

Events

Upcoming in-person and virtual events

ObservabilityCON 2025 (7-9 Oct)

Our flagship observability event

GrafanaCON 2025

Our annual OSS community conference

ObservabilityCON on the Road

Our observability conference on the road

Community

Join the Grafana community

Community forums

Ask the community for help

Resources

Blog

News, releases, cool stories, and more

Observability survey report 2025

Industry insights on the state of observability

Benefits of Observability

New research, reports, and insights

Success stories

By use case, product, and industry

How-to

Documentation

All the docs

Webinars and videos

Demos, webinars, and feature tours

Tutorials

Step-by-step guides

Workshops

Free, in-person or online

Learning Journeys

Expert guidance for mastering our platform

Professional Services

Expert guidance and training

Docs
Pricing

Help build the future of open source observability software Open positions

Check out the open source projects we support Downloads

Sign in

Grafana Cloud

Monitor, analyze, and act faster with AI-powered observability.

Grafana Cloud
Grafana Cloud overview

LGTM+ Stack

Grafana Cloud Logs

Logs

Grafana

Grafana

Grafana Cloud Traces

Traces

Grafana Cloud Metrics

Metrics

Key Capabilities

AI/ML

AI/ML insights

Grafana Cloud Asserts

Contextual root cause analysis

Grafana SLO

SLO management

Grafana Alerting

Alerting

Plugins

Plugins

Observability Solutions

Application Observability

Application Observability

Infrastructure Observability

Infrastructure observability

Testing

Grafana Cloud k6

Performance testing

Synthetic Monitoring

Synthetic Monitoring

IRM

Incident

Incident response

OnCall

On-call management

The actually useful free plan

Grafana Cloud Free Tier
check

10k series Prometheus metrics

check

50GB logs, 50GB traces, 50GB profiles

check

500VUk k6 testing

check

20+ Enterprise data source plugins

check

100+ pre-built solutions

Create account
Grafana Cloud Logs

Grafana Loki

Multi-tenant log aggregation system

Grafana

Grafana

Query, visualize, and alert on data

Grafana Cloud Traces

Grafana Tempo

High-scale distributed tracing backend

Grafana Cloud Metrics

Grafana Mimir

Scalable and performant metrics backend

Grafana Cloud Profiles

Grafana Pyroscope

Scalable continuous profiling backend

Grafana Beyla

eBPF auto-instrumentation

Grafana Faro

Grafana Faro

Frontend application observability web SDK

Grafana Alloy

Grafana Alloy

OpenTelemetry Collector distribution with Prometheus pipelines

Grafana Cloud k6

Grafana k6

Load testing for engineering teams

Prometheus

Prometheus

Monitor Kubernetes and cloud native

OpenTelemetry

OpenTelemetry

Instrument and collect telemetry data

Graphite

Graphite

Scalable monitoring for time series data

All

Community resources

Dashboard templates
Try out and share prebuilt visualizations
Prometheus exporters
Get your metrics into Prometheus quickly

end-to-end solutions

Opinionated solutions that help you get there easier and faster

Kubernetes Monitoring

Kubernetes Monitoring

Get K8s health, performance, and cost monitoring from cluster to container

Application Observability

Application Observability

Monitor application performance

Frontend Observability

Frontend Observability

Gain real user monitoring insights

Incident Response & Management

Incident Response & Management

Detect and respond to incidents with a simplified workflow

monitor infrastructure

Out-of-the-box KPIs, dashboards, and alerts for observability

linux server logo Linux
windows logo Windows
docker logo Docker
postgresql logo Postgres
mysql logo MySQL
aws logo AWS
kafka logo Kafka
jenkins logo Jenkins
rabbitmq logo RabbitMQ
mongodb logo MongoDB
microsoft azure observability logo Microsoft Azure
google cloud observability with grafana cloud logo Google Cloud

visualize any data

Instantly connect all your data sources to Grafana

mongodb logo MongoDB
appdynamics logo AppDynamics
oracle database logo Oracle
gitlab logo GitLab
jira logo Jira
salesforce logo Salesforce
splunk logo Splunk
datadog logo Datadog
new relic logo New Relic
snowflake logo Snowflake
All monitoring and visualization solutions

Community and events

Events

ObservabilityCON 2025 (7-9 Oct)

GrafanaCON 2025

ObservabilityCON on the Road

Community

Community forums

Resources

Blog

Observability survey report 2025

Benefits of Observability

Success stories

How-to

Documentation

Webinars and videos

Tutorials

Workshops

Learning Journeys

Professional Services

Featured webinar

Getting started with grafana LGTM stack

Getting started with managing your metrics, logs, and traces using Grafana

Learn how to unify, correlate, and visualize data with dashboards using Grafana.

Learn more →
Blog
  • All
  • Community
  • Culture
  • Engineering
  • News
  • Release
Blog
  • All
  • Community
  • Culture
  • Engineering
  • News
  • Release
Tags

GrafanaCon

View all tags
GrafanaCON 2024: On-demand sessions are now available!

Kristin Knapp   ·   25 Apr 2024   ·   6 min read

GrafanaCON 2024: On-demand sessions are now available!

Weren’t able to join us in person at GrafanaCON 2024? You can now catch up on all the exciting announcements and user stories with our on-demand...

GrafanaCon
Events

Read more


GrafanaCON 2024 Keynote Recap webinars: Register today to catch up on all the latest announcements

Grafana Labs Team   ·   17 Apr 2024   ·   2 min read

GrafanaCON 2024 Keynote Recap webinars: Register today to catch up on all the latest announcements

With our GrafanaCON 2024 Keynote Recap webinars, you can catch up on all the big news out of GrafanaCON this year – including the release of Grafana...

Community
GrafanaCon
Events

Read more


Find your logs data with Explore Logs: No LogQL required!

Mat Ryer   ·   9 Apr 2024   ·   9 min read

Find your logs data with Explore Logs: No LogQL required!

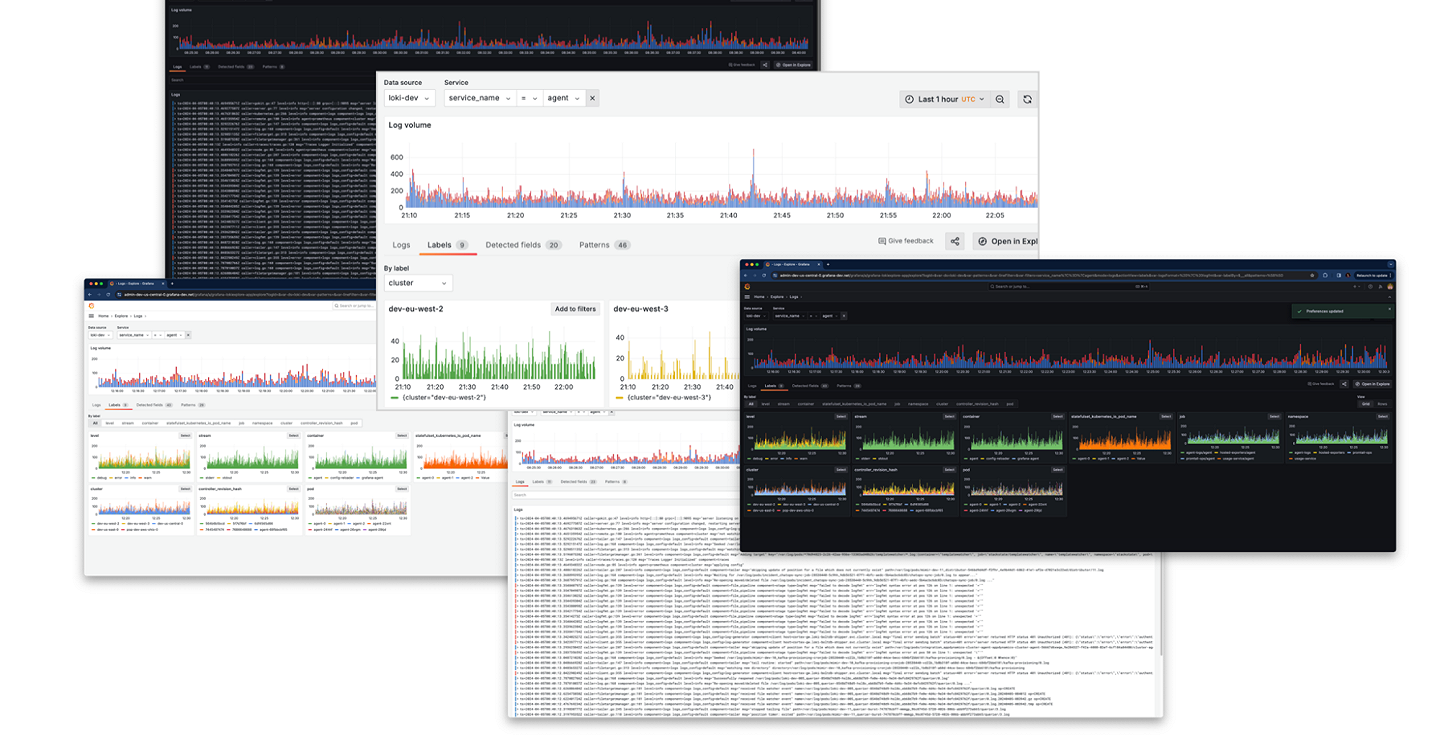
Learn all about Explore Logs, a new way to browse your logs in Grafana 11 and Loki 3.0 without writing LogQL.

Loki
Logging
GrafanaCon

Read more


Grafana 11 release: The latest in visualizations, Scenes-powered dashboards, simple access controls, and more

Mitch Seaman   ·   9 Apr 2024   ·   11 min read

Grafana 11 release: The latest in visualizations, Scenes-powered dashboards, simple access controls,...

Learn about all the latest features in the Grafana 11 release.

Grafana
GrafanaCon
Drilldown

Read more


GrafanaCON 2024: A guide to all the announcements from Grafana Labs

Michelle Tan   ·   9 Apr 2024   ·   6 min read

GrafanaCON 2024: A guide to all the announcements from Grafana Labs

Catch up on all the latest news out of GrafanaCON 2024, including the release of Grafana 11 and Grafana Loki 3.0.

Grafana
Events
Community
Company news
GrafanaCon

Read more


Loki 3.0 release: Bloom filters, native OpenTelemetry support, and more!

Salva Corts   ·   9 Apr 2024   ·   8 min read

Loki 3.0 release: Bloom filters, native OpenTelemetry support, and more!

Learn about all the latest features in Grafana Loki 3.0.

Loki
GrafanaCon

Read more


The Golden Grot Awards are back: Vote for your favorite dashboard

Grafana Labs Team   ·   26 Feb 2024   ·   8 min read

The Golden Grot Awards are back: Vote for your favorite dashboard

Voting is now open for the Golden Grot Awards, which recognize the very best Grafana dashboards. Pick your favorite personal and professional...

Golden Grots
Community
GrafanaCon
Grafana

Read more


GrafanaCON 2024: In April, in Amsterdam, and in person!

Michelle Tan   ·   11 Jan 2024   ·   3 min read

GrafanaCON 2024: In April, in Amsterdam, and in person!

GrafanaCON is back in Amsterdam and back in person! Learn more about our biggest community event of the year.

GrafanaCon
Events
Company news

Read more


How to monitor SLOs with Grafana, Grafana Loki, Prometheus, and Pyrra: Inside the Daimler Truck observability stack

Lauren Johnson   ·   25 Sep 2023   ·   4 min read

How to monitor SLOs with Grafana, Grafana Loki, Prometheus, and Pyrra: Inside the Daimler Truck...

How Daimler Truck uses Grafana, Loki, Prometheus, and Pyrra to maximize uptime and minimize latency for their connected vehicle service.

GrafanaCon
Community
Loki
Prometheus

Read more


Reduce MTTR with Grafana, Grafana k6, and Prometheus: Inside DHL’s observability stack

Lauren Johnson   ·   16 Aug 2023   ·   5 min read

Reduce MTTR with Grafana, Grafana k6, and Prometheus: Inside DHL’s observability stack

Find out how DHL Switzerland radically transformed their stack to reduce MTTR and make a smooth migration to the public cloud.

Community
k6
Prometheus
Grafana
GrafanaCon

Read more


Meet our Golden Grot Awards grand prize winners!

Grafana Labs Team   ·   15 Jun 2023   ·   8 min read

Meet our Golden Grot Awards grand prize winners!

Community
GrafanaCon
Dashboard
Golden Grots
Golden Grot winners

Read more


GrafanaCON 2023: A guide to all the big announcements from Grafana Labs

Michelle Tan   ·   13 Jun 2023   ·   5 min read

GrafanaCON 2023: A guide to all the big announcements from Grafana Labs

The largest community event of the year kicked off with the latest major release of Grafana, new additions to Grafana Cloud, and much more.

Events
GrafanaCon
Company news

Read more


From home automation to personal fitness: Check out these Grafana homelab projects

Kristin Knapp   ·   15 May 2023   ·   3 min read

From home automation to personal fitness: Check out these Grafana homelab projects

Whether you want to monitor a home thermostat or your training regimen, get inspired to kick off your next homelab project with these GrafanaCON 2023...

Events
Community
GrafanaCon

Read more


Space, energy, security: Discover different Grafana use cases

Grafana Labs Team   ·   8 May 2023   ·   6 min read

Space, energy, security: Discover different Grafana use cases

Community
GrafanaCon

Read more


Learn how to monitor IoT devices with Grafana

Grafana Labs Team   ·   24 Apr 2023   ·   4 min read

Learn how to monitor IoT devices with Grafana

Events
GrafanaCon

Read more


  • ««
  • «
  • 1
  • 2
  • 3
  • 4
  • 5
  • »
  • »»
Sign up for Grafana stack updates
Note: By signing up, you agree to be emailed related product-level information.


Products
  • Grafana Cloud
  • Grafana Enterprise Stack
  • Grafana visualizations
  • Plugins
  • Grafana Cloud Logs
  • Grafana Cloud Metrics
  • Grafana Cloud Traces
  • Grafana Cloud Profiles
  • AI/ML tools for observability
  • Application Observability
  • Frontend Observability
  • Grafana Cloud Asserts
  • Grafana IRM
  • Grafana k6
  • Grafana SLO
  • Synthetic Monitoring
  • Solutions
  • Pricing
Open Source
  • Grafana
  • Grafana Alloy
  • Grafana Beyla
  • Grafana Faro
  • Grafana k6
  • Grafana Loki
  • Grafana Mimir
  • Grafana OnCall
  • Grafana Pyroscope
  • Grafana Tanka
  • Grafana Tempo
  • Graphite
  • OpenTelemetry
  • Prometheus
  • Dashboard templates
  • Downloads
  •   GitHub
Learn
  • Documentation
  • Grafana Labs blog
  • Webinars and videos
  • Tutorials
  • Workshops
  • Events
  • Community
  • Professional Services
  • Community forums
  • Community Slack
  • Grafana Champions
  • Community organizers
  • Observability Survey Report 2025
  • OSS vs Cloud
  • Writers' Toolkit
  • Plugin development
  • Load testing
  • OpenTelemetry Report
  • Log monitoring
Company
  • Partnerships
  • Our team
  • Careers
  • Success stories
  • Newsroom
  • Contact us
  • Getting help
  • Merch
  • Open positions We're hiring
  • The Story of Grafana
Compare
  • Grafana vs. Datadog
Localized content
  • Japanese pages
  • German pages
  • French pages
  • Spanish pages
  • Portuguese pages

  • Grafana Cloud status
  • Legal and Security
  • Terms of Service
  • Privacy Policy
  • Trademark Policy
Copyright 2025 © Grafana Labs
Grafana Labs uses cookies for the normal operation of this website. Learn more.