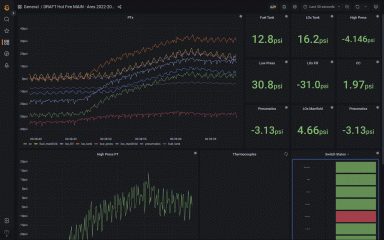
Monitoring a hard water softener at home with Grafana Cloud
Read more
Read more
With the release of Grafana 9, you can now navigate Grafana with a few simple keystrokes.
Read more
Read more
The Grafana 9.0 release is here! Check out all the new features in Grafana's user experience, accessibility, panel and dashboard searchability, and...
Read more
Grafana Alerting is now the default alerting system in Grafana, and we are introducing significant improvements based on your feedback, as well as...
Read more
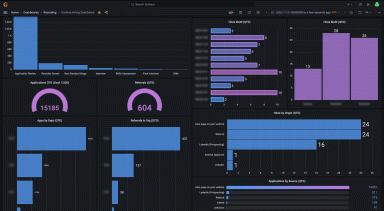
Creating dashboard chaos is easy. Knowing what types of Grafana dashboards your team will need helps to create a structure for organizing and finding...
Read more
How we use the BigQuery plugin, dbt, and Grafana for business intelligence in our modern data stack.
Read more
The trace to log enablement for Splunk will give you deeper insights from your Splunk log data.
Read more
Read more
Grafana 8.5 has been released with features focused on ease of use, new data visualizations, and enhanced security.
Read more
One man's personal garden bot helped inspire a business that uses Grafana to monitor data that is revolutionizing farming and increasing yields.
Read more
With the WebSockets plugin, you can use a Grafana panel to get immediate feedback on the health of your devices.
Read more
Using time series panels and Grafana Live streaming, Doom fans can now pursue total annihilation on Grafana.
Read more
Read more
Here are the best practices for using Teams, Orgs, and Instances in Grafana.
Read more