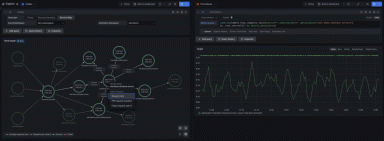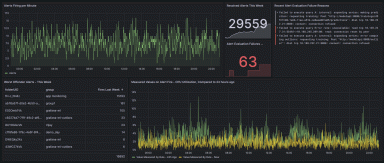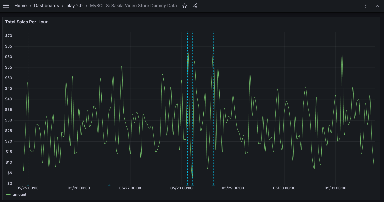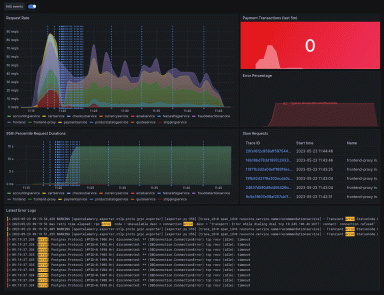
How KCB Bank Uganda greatly improved transaction service monitoring with Grafana
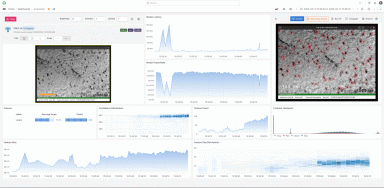
KCB Bank Uganda uses Grafana to track the status of its services and systems at a granular level, which helps to improve service uptime for its...
Read more
Products
LGTM+ Stack
Key Capabilities
Observability Solutions
IRM
Deploy The Stack
Open Source
Community resources
Dashboard templates
Try out and share prebuilt visualizations
Prometheus exporters
Get your metrics into Prometheus quickly
end-to-end solutions
Opinionated solutions that help you get there easier and faster
monitor infrastructure
Out-of-the-box KPIs, dashboards, and alerts for observability
visualize any data
Instantly connect all your data sources to Grafana
Learn
Stay up to date
Technical learning
Docs
Get started
Get started with Grafana
Build your first dashboard
Get started with Grafana Cloud
What's new / Release notes
Help build the future of open source observability software Open positions
Check out the open source projects we support Downloads
Deploy The Stack
end-to-end solutions
Opinionated solutions that help you get there easier and faster
visualize any data
Instantly connect all your data sources to Grafana
Mary Margaret · 14 Dec 2022 · 3 min read
KCB Bank Uganda uses Grafana to track the status of its services and systems at a granular level, which helps to improve service uptime for its...
Read more
Tony Leopold · 13 Dec 2022 · 4 min read
Read more
Eric Leijonmarck · 12 Dec 2022 · 8 min read
Our new command in Grafana CLI helps you resolve logins or emails that have case-insensitive conflicts.
Read more
Mihály Gyöngyösi · 8 Dec 2022 · 4 min read
Read more
Zsofia Komaromi · 7 Dec 2022 · 3 min read
Read more
Ishan Jain · 6 Dec 2022 · 6 min read
Read more
Ricardo Liberato · 2 Dec 2022 · 9 min read
Read more
Grafana Labs Team · 29 Nov 2022 · 11 min read
Read more
Trevor Jones · 28 Nov 2022 · 5 min read
Latin America's biggest bank relies on Grafana for better insights into the performance of infrastructure and applications hosted on premises and in...
Read more
Grafana Labs Team · 21 Nov 2022 · 4 min read
Medallia's Performance and Observability Engineering team relies on Grafana to unify observability and optimize internal users' experience.
Read more
Mary Margaret · 18 Nov 2022 · 3 min read
Adform centralized its observability system on Grafana so developers can choose their preferred tools and the DevOps team can have the oversight it...
Read more
Matias Wenceslao Chomicki · 15 Nov 2022 · 3 min read
No exact syntax required! The Grafana Loki query variable editor provides an easy drop-down menu to choose between data sources in Grafana.
Read more
Ryan McKinley · 17 Oct 2022 · 3 min read
Read more
Grafana Labs Team · 11 Oct 2022 · 8 min read
Read more
Joey Bartolomeo · 23 Sep 2022 · 3 min read
Read more
Bring your crew,
save up to 20%
Don't miss out—Be the first to dive into Grafana 12, Prometheus 3.0, and our nearly sold-out hands-on labs on Grafana as Code, OpenTelemetry, and more.
After last year's record sellout, our biggest community event is headed to Seattle on May 6-8! Discover what's new in Grafana 12, learn from 20+ talks covering Prometheus, OpenTelemetry, & Loki, and much more.
No credit card needed, ever.
Become a Champion
Helping others embodies the spirit of open source, and we want to celebrate your invaluable contributions.
Become a ChampionGolden Grots
Helping others embodies the spirit of open source, and we want to celebrate your invaluable contributions.
Submit your dashboardBecome a Contributor
Helping others embodies the spirit of open source, and we want to celebrate your invaluable contributions.
Gain insight into unused metrics and optimize metric cardinality with the new cardinality management dashboards and Adaptive Metrics