Do you need an OpenTelemetry Collector?
OpenTelemetry users often push logs, metrics, and traces to a collector before sending them to their backend. Find out why this is such a popular...
Read more
Products
Grafana Cloud
Monitor, analyze, and act faster with AI-powered observability.
LGTM+ Stack
Key Capabilities
Observability Solutions
end-to-end solutions
Opinionated solutions that help you get there easier and faster
monitor infrastructure
Out-of-the-box KPIs, dashboards, and alerts for observability
visualize any data
Instantly connect all your data sources to Grafana
Grafana Cloud
Monitor, analyze, and act faster with AI-powered observability.
The actually useful free plan
10k series Prometheus metrics
50GB logs, 50GB traces, 50GB profiles
500VUk k6 testing
20+ Enterprise data source plugins
100+ pre-built solutions
Opinionated solutions that help you get there easier and faster
Instantly connect all your data sources to Grafana
Getting started with managing your metrics, logs, and traces using Grafana
Learn how to unify, correlate, and visualize data with dashboards using Grafana.
OpenTelemetry users often push logs, metrics, and traces to a collector before sending them to their backend. Find out why this is such a popular...
Read more
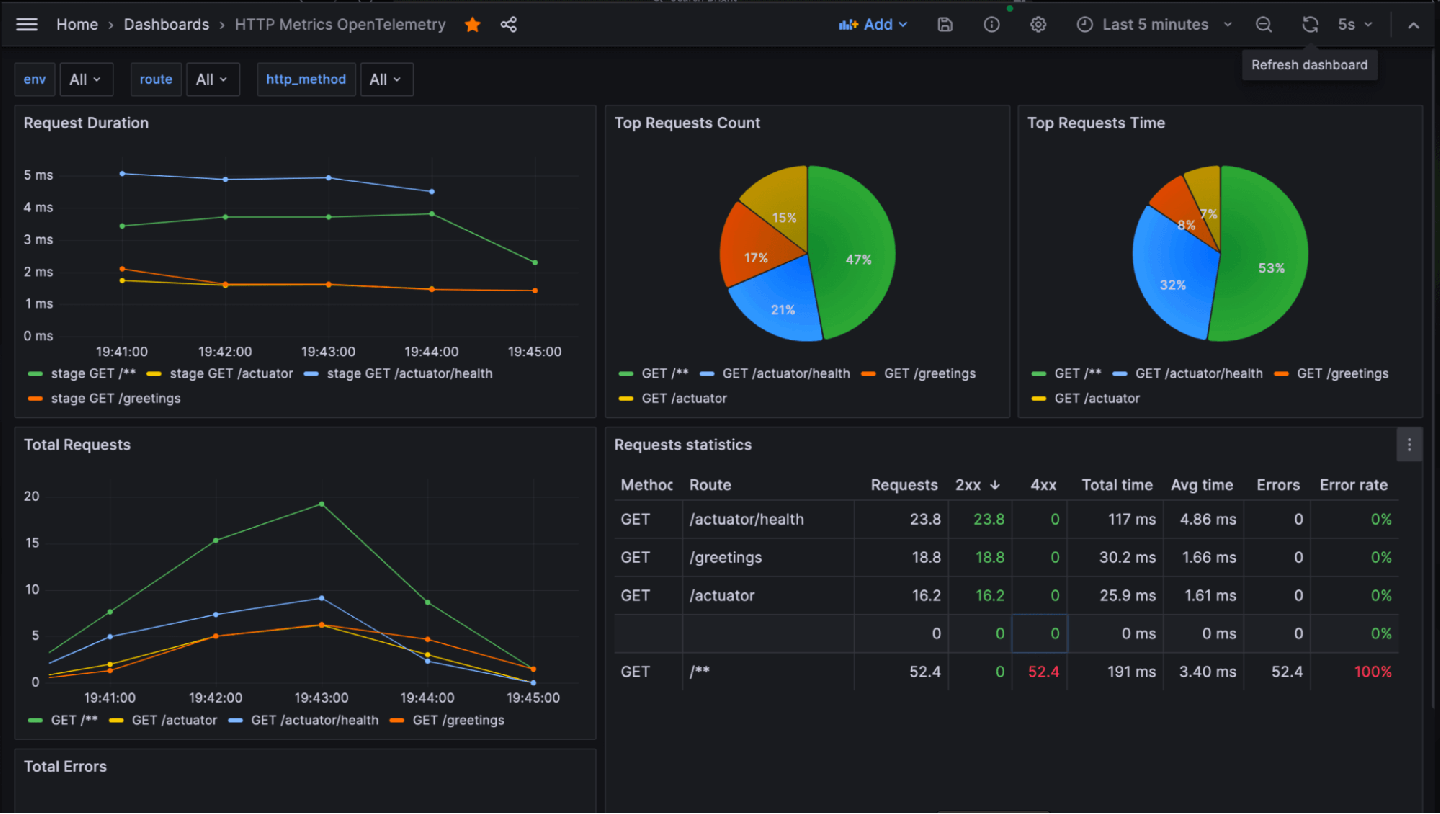
Learn how to integrate a Spring Boot application with Grafana using OpenTelemetry standards. And follow along by checking out practical examples in...
Read more
The all-new Grafana developer portal is a central hub of curated resources for developers who want to extend Grafana's capabilities.
Read more
Grafana 10.2 delivers exciting new visualization capabilities, AI assistance with dashboard titles, and more
Read more
Learn how to quickly and easily find the current value of a metric from a range in a Grafana dashboard.
Read more
There are lots of ways to embed Grafana dashboards into other web apps, but the number of choices can also lead to confusion. Learn about the...
Read more
Sentry Software ditched its legacy electricity monitoring solutions and safely reduced data center energy usage by 19% with Hardware Sentry, Grafana,...
Read more
Due to an ARM-specific bug in the Go compiler, we will temporarily cease distributing any new 32-bit ARM versions of Grafana or Grafana Enterprise.
Read more
Grafana Labs partnered with Microsoft to develop Grafana updates that will help with the transition from Azure Active Directory Pod Identity...
Read more
They span across land, sea, space, and virtual worlds. Check out some of the most memorable Grafana dashboards from the past decade.
Read more
Grafana has been a game-changer for a group of universities looking for a secure and customizable solution for monitoring digital archives.
Read more
Grafana Scenes, a new frontend library that lets you build dynamic dashboarding experiences within Grafana apps, is now generally available.
Read more
Oh my grep — how Grafana 10 makes debugging issues easier with logging
Read more
Improved flame graphs, new geomap network layer visualization, and much more. Grafana 10.1 is here!
Read more
Find out how DHL Switzerland radically transformed their stack to reduce MTTR and make a smooth migration to the public cloud.
Read more