GrafanaCON 2024: A guide to all the announcements from Grafana Labs
Catch up on all the latest news out of GrafanaCON 2024, including the release of Grafana 11 and Grafana Loki 3.0.
Read more
Products
Grafana Cloud
Monitor, analyze, and act faster with AI-powered observability.
LGTM+ Stack
Key Capabilities
Observability Solutions
end-to-end solutions
Opinionated solutions that help you get there easier and faster
monitor infrastructure
Out-of-the-box KPIs, dashboards, and alerts for observability
visualize any data
Instantly connect all your data sources to Grafana
Grafana Cloud
Monitor, analyze, and act faster with AI-powered observability.
The actually useful free plan
10k series Prometheus metrics
50GB logs, 50GB traces, 50GB profiles
500VUk k6 testing
20+ Enterprise data source plugins
100+ pre-built solutions
Opinionated solutions that help you get there easier and faster
Instantly connect all your data sources to Grafana
Getting started with managing your metrics, logs, and traces using Grafana
Learn how to unify, correlate, and visualize data with dashboards using Grafana.
Catch up on all the latest news out of GrafanaCON 2024, including the release of Grafana 11 and Grafana Loki 3.0.
Read more
Learn about some of the recently added visualization capabilities in Grafana that make it easier to surface trends in your data.
Read more
Learn how some of the world's biggest shipping and logistics companies use the Grafana LGTM Stack to ensure the best possible customer experience.
Read more
Don’t get caught by surprise. Here’s everything you need to know about the upcoming removal of AngularJS in Grafana 11, so you can migrate and keep...
Read more
The Grafana 10.4 release includes visualization updates, a new plugin, and a preview of functionality we intend to make generally available in Grafana...
Read more
Learn how to use the new SurrealDB data source plugin to visualize data from this multimodal database directly in Grafana.
Read more
Voting is now open for the Golden Grot Awards, which recognize the very best Grafana dashboards. Pick your favorite personal and professional...
Read more
A look back at a decade of dashboarding and the community and innovation that will power the next ten years and beyond
Read more
Grafana Labs will be maintaining and managing the Grafana Operator, the open source Kubernetes operator that helps you manage your Grafana instances...
Read more
Grafana 10.3 introduces new visualization features, multi-stack data source queries, and improvements to help manage your Grafana instance.
Read more
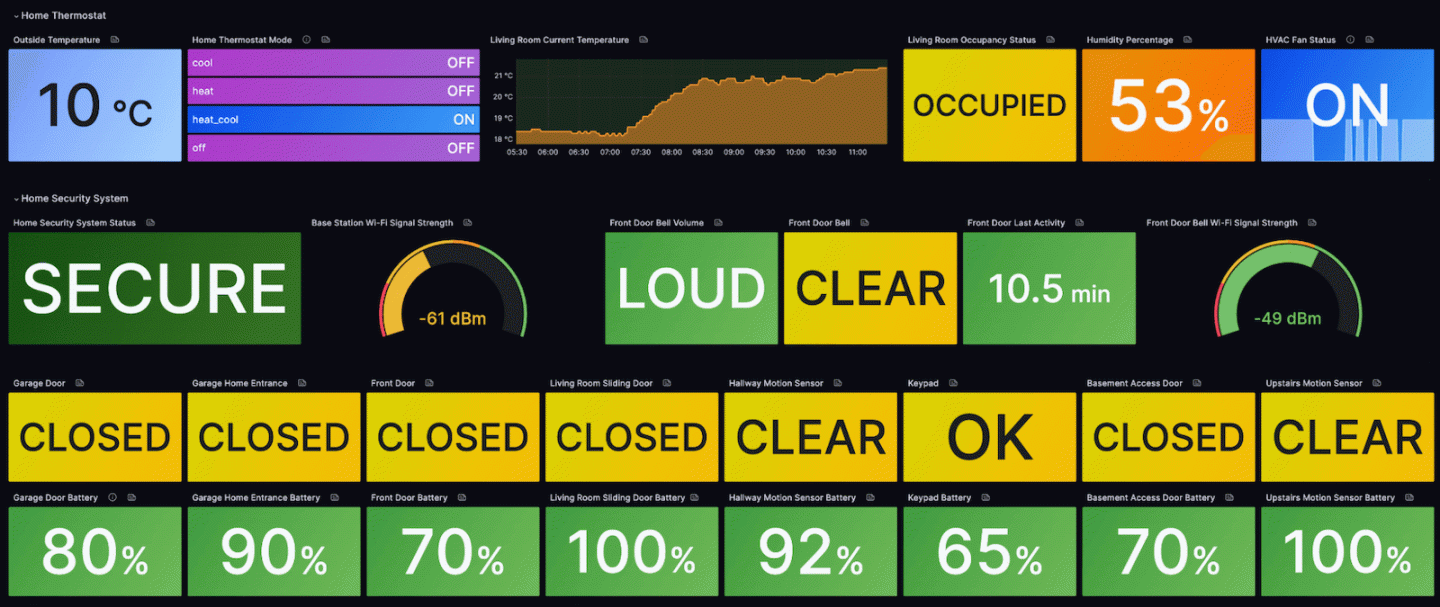
Find out how to use Grafana Cloud to visualize and monitor your home with smart devices.
Read more
The upgrade to the Grafana 10.2.3 patch release should be treated as an upgrade to a minor version because there are breaking changes and new features...
Read more
How Grafana community members are using their dashboards for projects at work and at home
Read more
The four-part documentary series tells the origin story of Grafana, growing from a personal project to become a thriving open source community and an...
Read more
With the new 'No basic role' in Grafana, you'll improve access control and the overall security of your Grafana instance.
Read more