3D printing and observability: How Prusa Research monitors its huge printer farm with Grafana
A recap of an episode of "Grafana's Big Tent" about Prusa Research using Grafana to monitor its printer farms
Read more
Products
Grafana Cloud
Monitor, analyze, and act faster with AI-powered observability.
LGTM+ Stack
Key Capabilities
Observability Solutions
end-to-end solutions
Opinionated solutions that help you get there easier and faster
monitor infrastructure
Out-of-the-box KPIs, dashboards, and alerts for observability
visualize any data
Instantly connect all your data sources to Grafana
Grafana Cloud
Monitor, analyze, and act faster with AI-powered observability.
The actually useful free plan
10k series Prometheus metrics
50GB logs, 50GB traces, 50GB profiles
500VUk k6 testing
20+ Enterprise data source plugins
100+ pre-built solutions
Opinionated solutions that help you get there easier and faster
Instantly connect all your data sources to Grafana
Getting started with managing your metrics, logs, and traces using Grafana
Learn how to unify, correlate, and visualize data with dashboards using Grafana.
A recap of an episode of "Grafana's Big Tent" about Prusa Research using Grafana to monitor its printer farms
Read more
Learn how The National Library of the Netherlands uses Grafana to help support its mission of preserving and providing Dutch literature for the...
Read more
Learn how CERN uses Grafana and Mimir to help 12,000 global researchers access data from the world's largest particle physics lab.
Read more
A look at some of the most creative uses of Grafana dashboards of 2024
Read more
With Grafana 11.4, the AWS Cloudwatch data source plugin now supports querying Cloudwatch Logs Insights with OpenSearch PPL and OpenSearch SQL.
Read more
In Grafana Alerting, Grafana-managed recording rules can save you time and effort in setting up and managing your incident response.
Read more
In the latest episode of "Grafana's Big Tent" podcast, Grafana Labs team members recap the highlights of the Grafana 11 release, and offer an early...
Read more
Learn about some important Grafana release updates on end-of-year release freezes, security versioning, and the new docs page for all things...
Read more
In this post, you'll learn how to create Grafana dashboards featuring data from disparate sources, how to incorporate multiple queries from a single...
Read more
Grafana's frontend has undergone a major upgrade under the hood. See why we migrated our dashboard architecture to utilize the Grafana Scenes library...
Read more
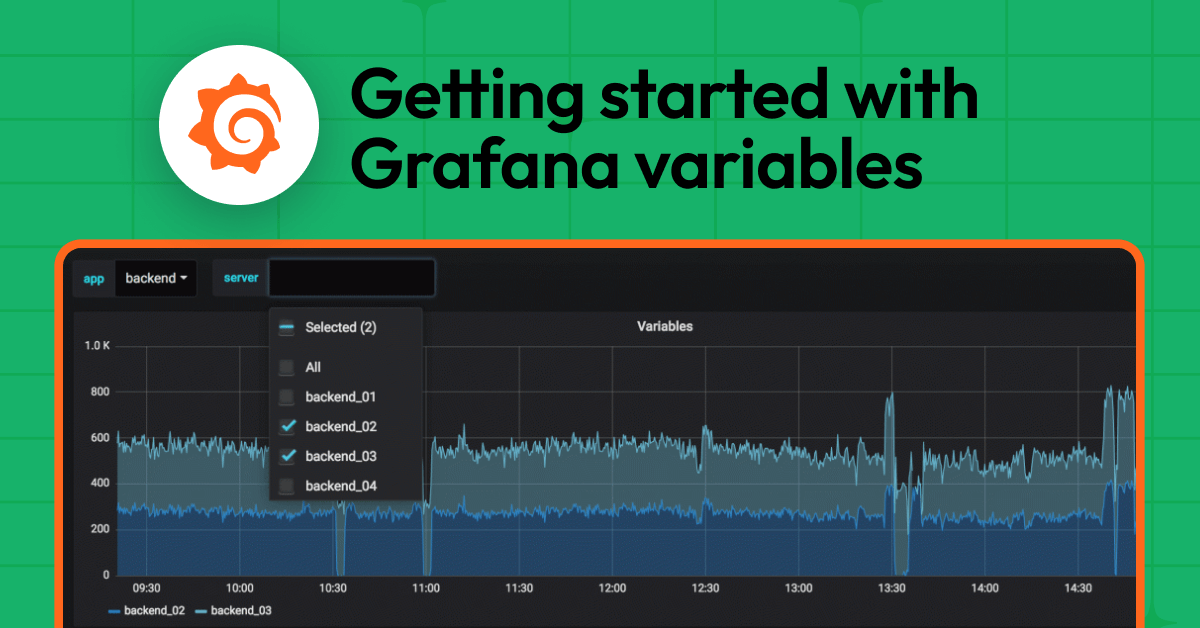
Variables in Grafana allow you to filter and search for the data you care about most, without having to edit queries or rebuild dashboards.
Read more
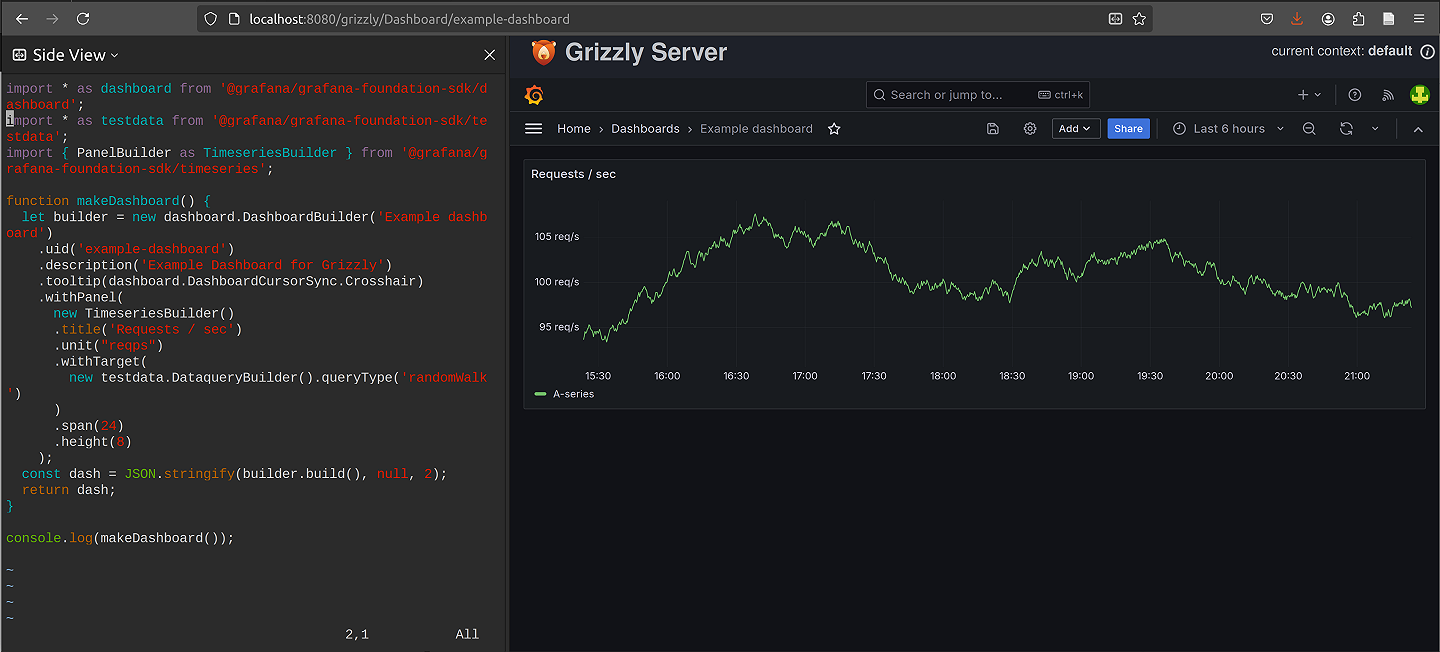
Simplify the management of Grafana dashboards in Git by managing them as code, outside of Grafana.
Read more
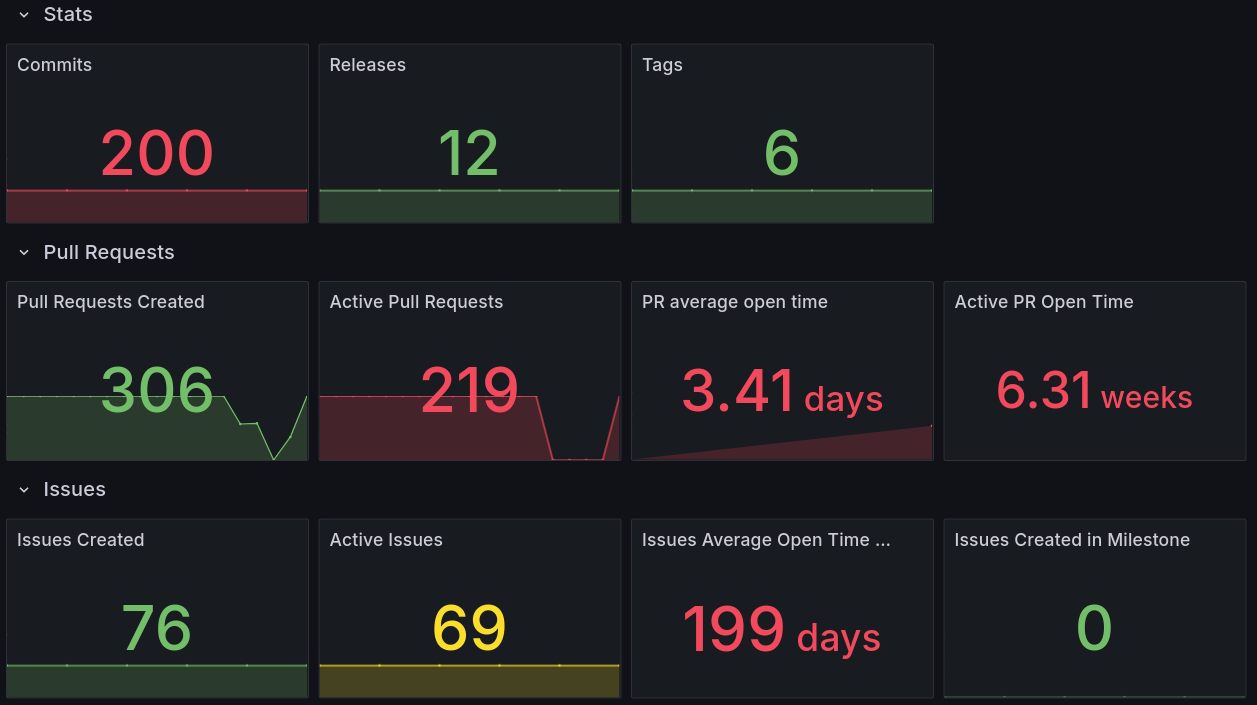
Learn how to use the GitHub data source plugin to visualize data related to your team’s daily use of the popular version control and collaboration...
Read more
Grafana 11.3 marks the general availability of Scenes-powered dashboards plus introduces more features and functionality to improve your dashboarding...
Read more
From complex queries to queryless explorations, everyone—from beginners to experts—can get value out of their telemetry data and realize the full...
Read more