Introducing the MongoDB Enterprise plugin for Grafana
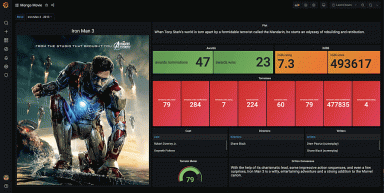
The MongoDB Enterprise plugin unlocks all of the data stored in MongoDB — including diagnostic metrics for monitoring MongoDB itself — for Grafana...
Read more
The MongoDB Enterprise plugin unlocks all of the data stored in MongoDB — including diagnostic metrics for monitoring MongoDB itself — for Grafana...
Read more
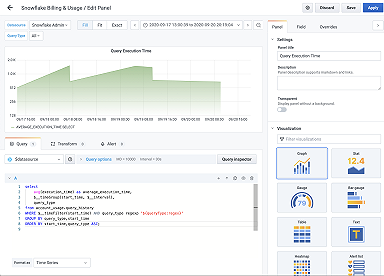
With the Snowflake plugin, you can visualize your Snowflake data alongside your other data sources in Grafana.
Read more
Read more
Read more
The ServiceNow plugin for Grafana now allows users to query tables, visualize data as annotations, and use ServiceNow for alerting.
Read more
Read more
Read more
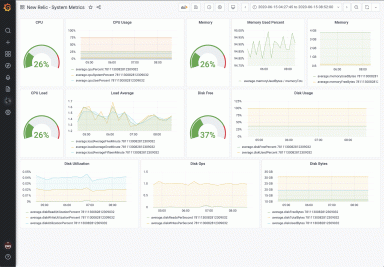
The New Relic data source plugin for Grafana delivers actionable dashboards, template variables in NRQL, and alerting.
Read more
Read more
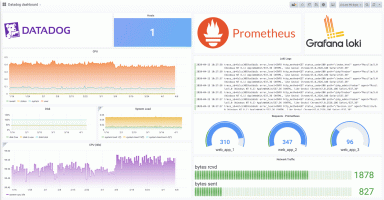
Grafana Labs experts share their best tips for querying, templating, and filtering within the Datadog enterprise plugin in Grafana.
Read more
Read more
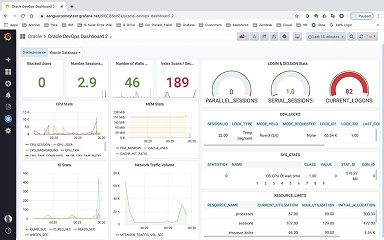
The Oracle data source plugin in Grafana gives users extensibility and the ability to mix queries across databases in real time.
Read more
The Splunk Enterprise plugin in Grafana allows you create a flexible view of the key metrics that measure the health of your systems.
Read more
Read more
Read more
