Introducing the Honeycomb plugin for Grafana
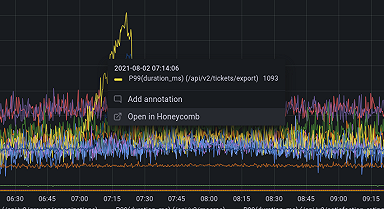
The Honeycomb Enterprise data source plugin for Grafana allows you to query and visualize Honeycomb data alongside your observability data.
Read more
The Honeycomb Enterprise data source plugin for Grafana allows you to query and visualize Honeycomb data alongside your observability data.
Read more
Read more
Day 5 at GrafanaCONline delivered in-depth demos on Grafana's new unified alerting system and how to use dashboards as code. Plus see how Grafana...
Read more
Grafana Alerting has been updated with the release of Grafana 9. To learn all about the new and improved alerting experience, check out our Grafana...
Read more
GrafanaCONline kicked off with new product announcements and a Q&A with Salesforce execs. Plus, check out how Grafana improved data monitoring in...
Read more
Read more
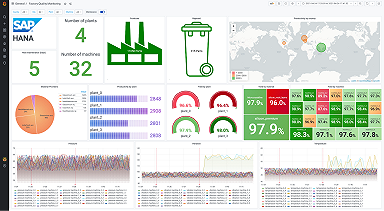
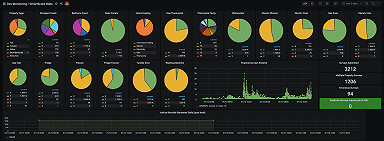
Visualize your SAP HANA® data alongside all of your data sources in Grafana, as well as log and metric data in context.
Read more
The Jira data source plugin in Grafana can give users across your organization comprehensive insights into their development process.
Read more
Read more
Read more
Read more
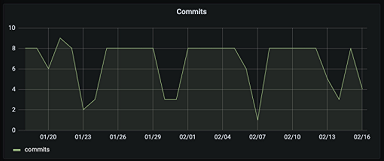
The GitLab data source plugin allows users to visualize development metrics and correlate them with events in Grafana.
Read more
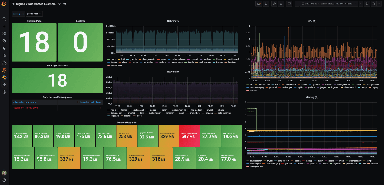
The Splunk Infrastructure Monitoring plugin for Grafana enables a flexible view of your systems and applications to quickly correlate and debug.
Read more
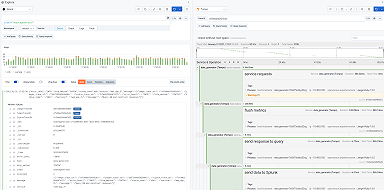
This Splunk Enterprise plugin for Grafana allows you to navigate between logs as well as Grafana Tempo, Zipkin, and Jaeger tracing backends without...
Read more
Read more
