Grafana Cloud updates: explore metrics without PromQL, native OpenTelemetry log support, cool...
Don't miss all of the latest and greatest features released this month in our fully managed Grafana Cloud observability platform.
Read more
Products
Grafana Cloud
Monitor, analyze, and act faster with AI-powered observability.
LGTM+ Stack
Key Capabilities
Observability Solutions
end-to-end solutions
Opinionated solutions that help you get there easier and faster
monitor infrastructure
Out-of-the-box KPIs, dashboards, and alerts for observability
visualize any data
Instantly connect all your data sources to Grafana
Grafana Cloud
Monitor, analyze, and act faster with AI-powered observability.
The actually useful free plan
10k series Prometheus metrics
50GB logs, 50GB traces, 50GB profiles
500VUh k6 testing
20+ Enterprise data source plugins
100+ pre-built solutions
Opinionated solutions that help you get there easier and faster
Instantly connect all your data sources to Grafana
Getting started with managing your metrics, logs, and traces using Grafana
Learn how to unify, correlate, and visualize data with dashboards using Grafana.
Don't miss all of the latest and greatest features released this month in our fully managed Grafana Cloud observability platform.
Read more
In addition to the benefits of Grafana Cloud, these three global companies credit their observability success to working closely with the Grafana Labs...
Read more
Learn how Grafana Labs maintains the highest standards of data privacy and security with Grafana Cloud, our fully managed observability platform.
Read more
ComplyAdvantage has used OpenTelemetry and Grafana Cloud to continually advance its observability strategy and make it more flexible.
Read more
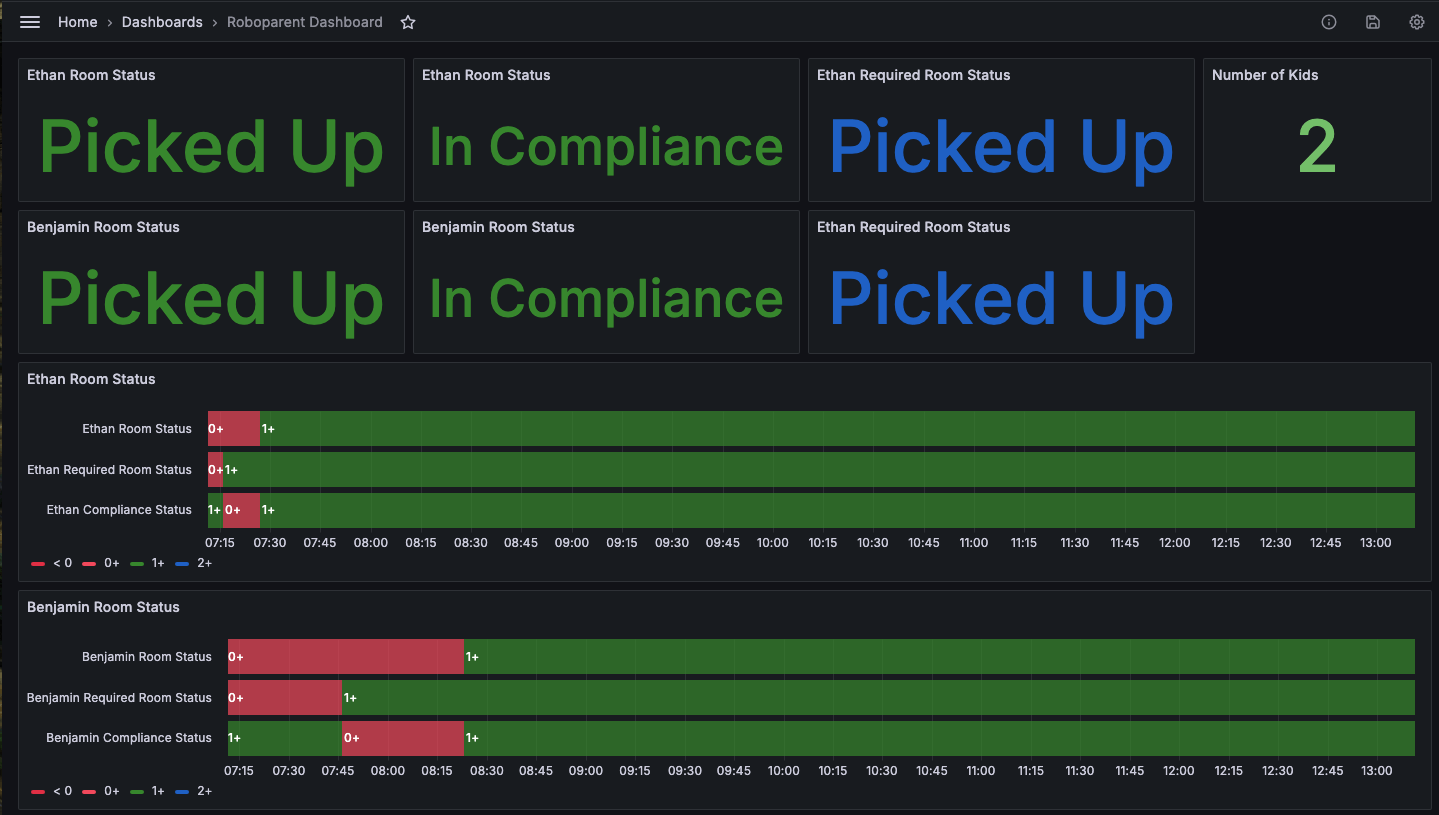
Motivating kids to clean their rooms — and keeping tabs on their progress — can be a challenge. Here’s how to make things a little easier with Grafana...
Read more
Learn how to automate image analysis — a previously time-intensive and manual task — with ChatGPT’s vision API and Grafana Cloud Metrics.
Read more
Learn how some of the world's biggest shipping and logistics companies use the Grafana LGTM Stack to ensure the best possible customer experience.
Read more
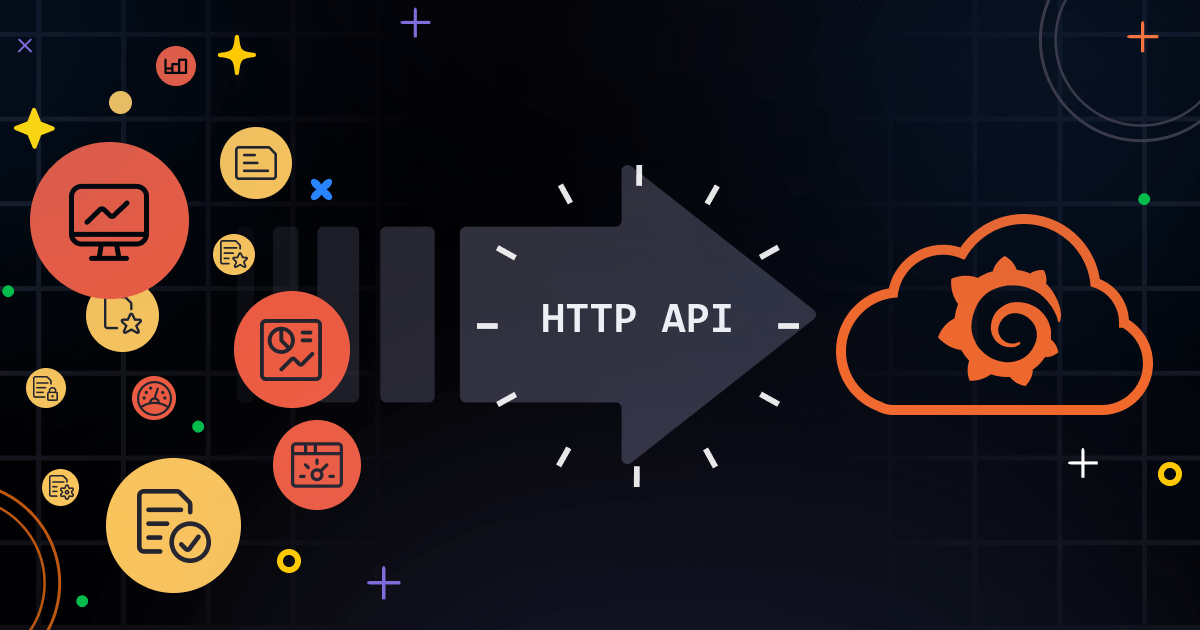
Using an agent isn't always feasible when working with serverless architectures, IoT systems, or batch jobs. Learn how to use an HTTP API to send your...
Read more
All of this month's latest and greatest features in the fully managed Grafana Cloud observability platform
Read more
Introducing AWS Observability, a user-centric app in Grafana Cloud that makes it easier than ever to monitor AWS for a diverse range of projects.
Read more
All of this month's latest and greatest features in the fully managed Grafana Cloud observability platform.
Read more
With a free Grafana Cloud account and a VPN service, you can ensure your network is secure by receiving real time alerts.
Read more
Learn how to monitor Rocky Linux, a RHEL-compatible open source operating system, using the Linux integration in Grafana Cloud.
Read more
From cost optimization to improved reliability, here are some of the biggest reasons companies choose to migrate to Grafana Cloud to manage and...
Read more
See how TeleTracking combined Prometheus and Grafana Cloud to give its users greater visibility into their services, lower overhead, and serve as key...
Read more