Shorten your feedback loop: Java observability with OpenTelemetry, Grafana Cloud, and Digma.ai
Reduce the time it takes for a developer to become aware of a bug and its source once it's introduced.
Read more
Products
Grafana Cloud
Monitor, analyze, and act faster with AI-powered observability.
LGTM+ Stack
Key Capabilities
Observability Solutions
end-to-end solutions
Opinionated solutions that help you get there easier and faster
monitor infrastructure
Out-of-the-box KPIs, dashboards, and alerts for observability
visualize any data
Instantly connect all your data sources to Grafana
Grafana Cloud
Monitor, analyze, and act faster with AI-powered observability.
The actually useful free plan
10k series Prometheus metrics
50GB logs, 50GB traces, 50GB profiles
500VUh k6 testing
20+ Enterprise data source plugins
100+ pre-built solutions
Opinionated solutions that help you get there easier and faster
Instantly connect all your data sources to Grafana
Getting started with managing your metrics, logs, and traces using Grafana
Learn how to unify, correlate, and visualize data with dashboards using Grafana.
Reduce the time it takes for a developer to become aware of a bug and its source once it's introduced.
Read more
How Dell successfully migrated to Grafana Cloud and consolidated its observability in the process
Read more
Explore the latest updates to Grafana Cloud Application Observability, including time frame comparisons to analyze app performance over time,...
Read more
Learn how Grafana Alloy clustering works, how it can be used alongside our agentless exporters, and how it can simplify scrape jobs in Grafana Cloud.
Read more
With this new feature, available now in Grafana Cloud, alerts flow from Grafana OnCall into ServiceNow and vice-versa, helping to keep incident...
Read more
Learn how to collect and analyze telemetry data from Google Cloud Run using OpenTelemetry and Application Observability in Grafana Cloud.
Read more
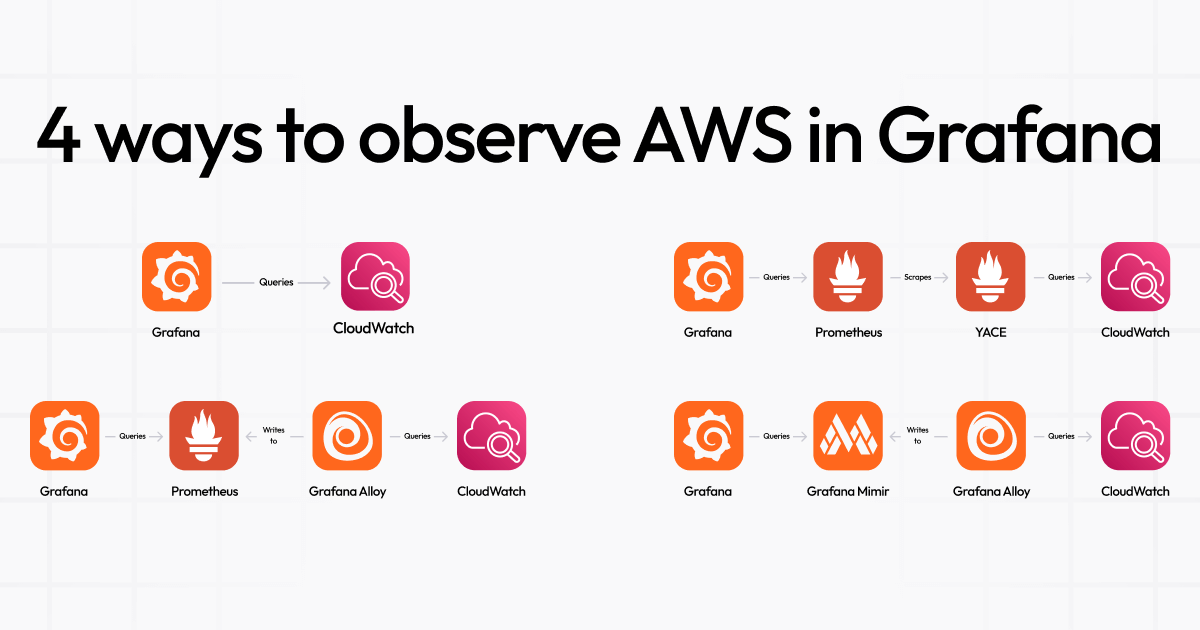
There are four ways to monitor AWS metrics in Grafana. Find out which one best fits your needs with this handy guide.
Read more
Catch up on all the latest and greatest features released this month in our fully managed Grafana Cloud observability platform.
Read more
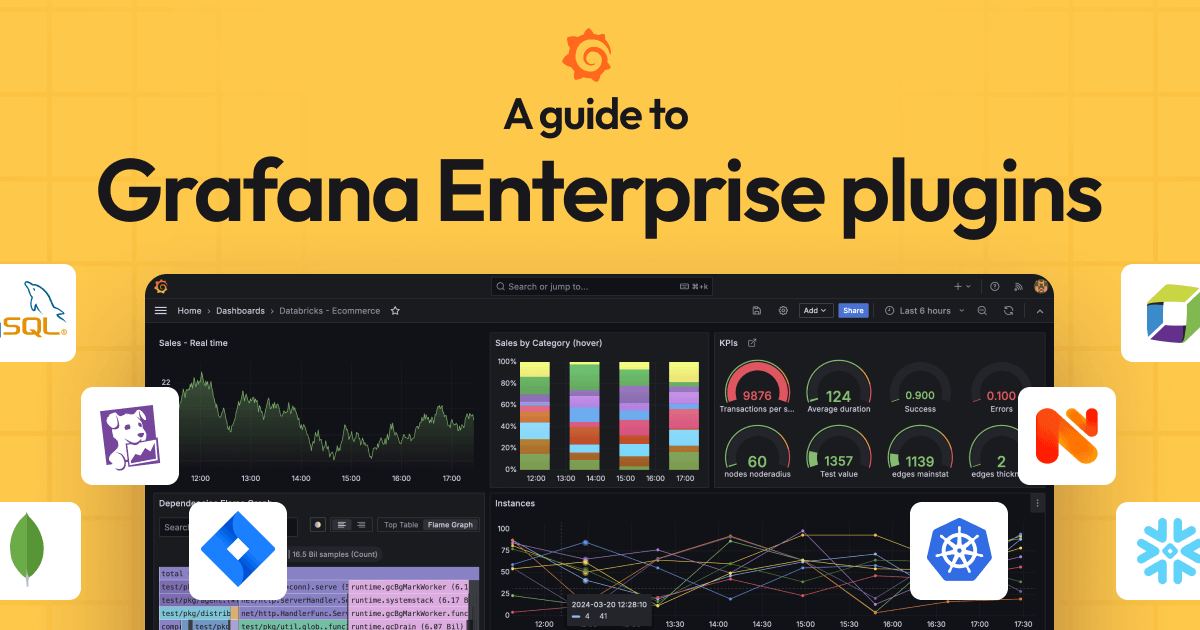
With Grafana Enterprise data sources, you can visualize data from a wide range of external systems using the Grafana dashboards you already know and...
Read more
Learn how to reduce complexity and configuration headaches when collecting Microsoft Azure metrics with Grafana Alloy.
Read more
Learn about the new way to ingest logs in the AWS Observability App, and why it should be your preferred approach for logs coming from CloudWatch and...
Read more
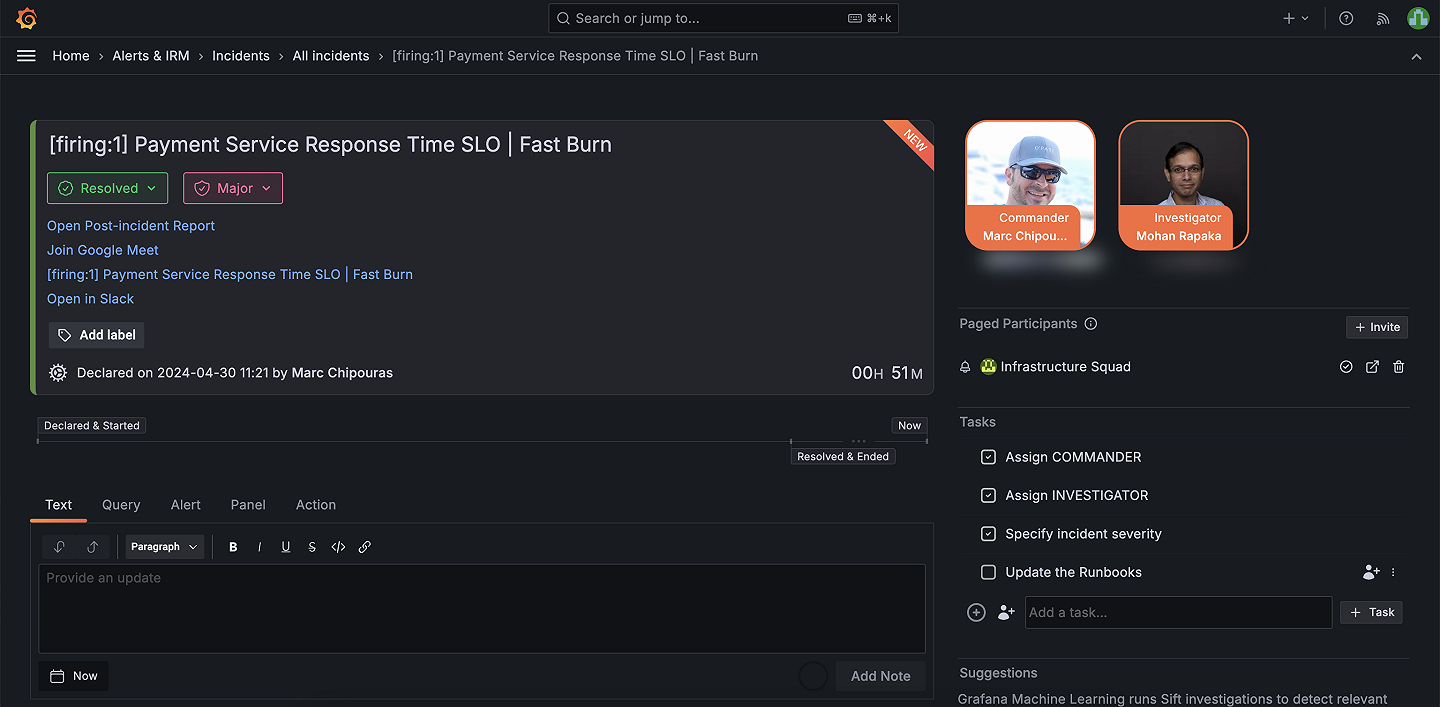
Check out some of the recent innovations that have reshaped our approach to incident management and get a quick preview of what's next in Grafana...
Read more
Learn how Synthetic Monitoring, powered by Grafana k6, creates multi-step synthetics to simulate complex transactions and end-user journeys.
Read more
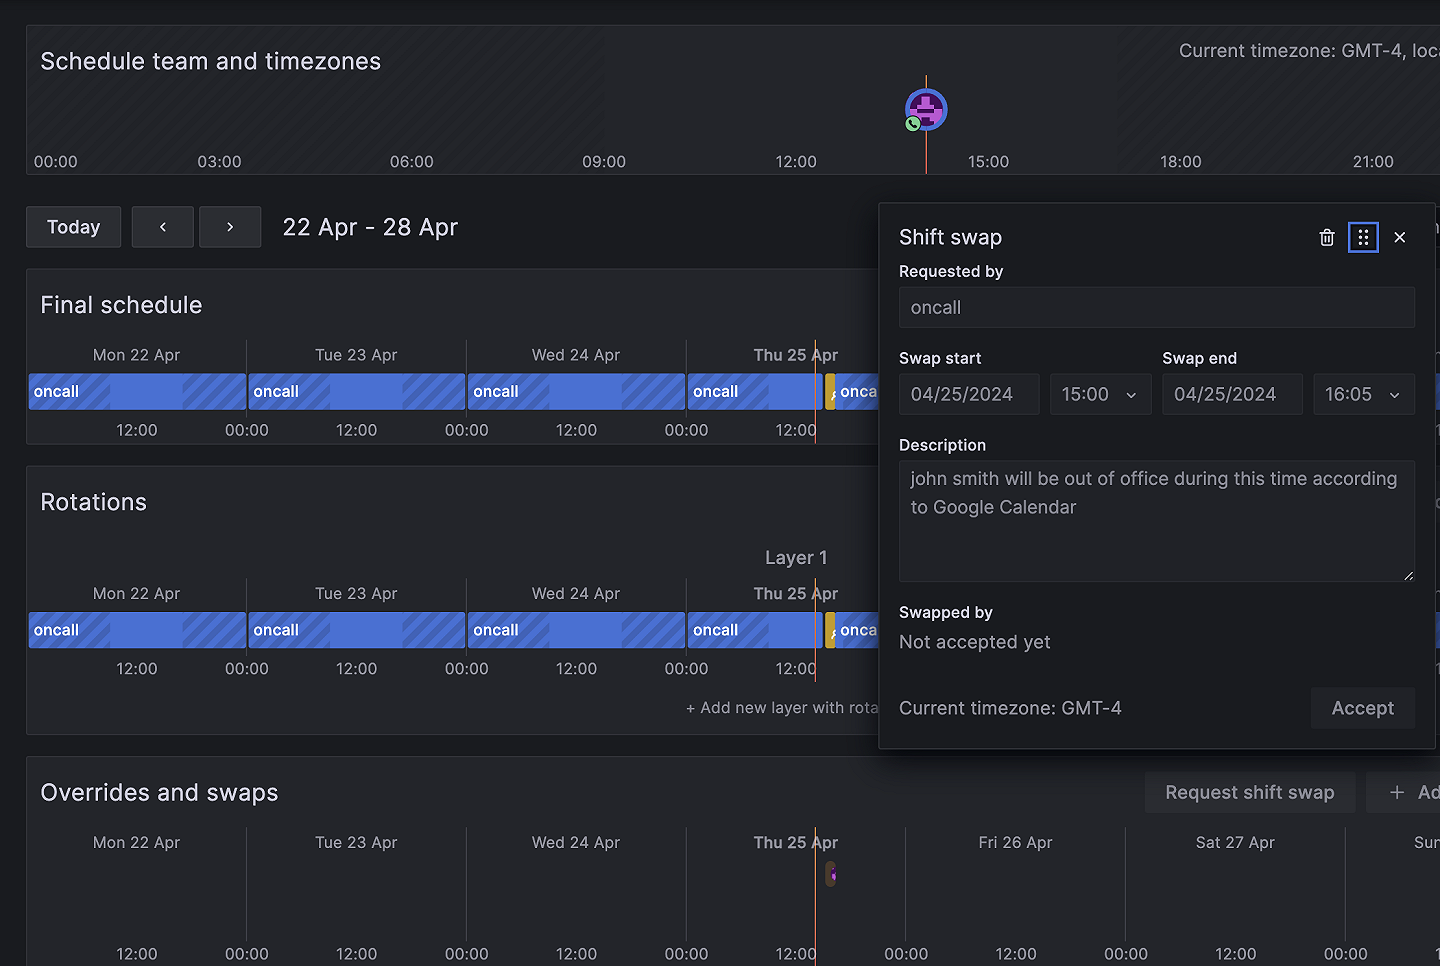
Avoid getting scheduled for an on-call duties during personal time and ensure your team's shifts are covered by syncing Grafana OnCall with Google...
Read more
By using the Grafana Operator for resource management within Kubernetes, you make it easier to incorporate Grafana Cloud into your Kubernetes-driven...
Read more