How to quickly configure Grafana Cloud Application Observability with OpenTelemetry Operator
Follow this step-by-step tutorial to learn how to configure the OpenTelemetry Operator with your Kubernetes cluster in just 20 minutes.
Read more
Products
Grafana Cloud
Monitor, analyze, and act faster with AI-powered observability.
LGTM+ Stack
Key Capabilities
Observability Solutions
end-to-end solutions
Opinionated solutions that help you get there easier and faster
monitor infrastructure
Out-of-the-box KPIs, dashboards, and alerts for observability
visualize any data
Instantly connect all your data sources to Grafana
Grafana Cloud
Monitor, analyze, and act faster with AI-powered observability.
The actually useful free plan
10k series Prometheus metrics
50GB logs, 50GB traces, 50GB profiles
500VUh k6 testing
20+ Enterprise data source plugins
100+ pre-built solutions
Opinionated solutions that help you get there easier and faster
Instantly connect all your data sources to Grafana
Getting started with managing your metrics, logs, and traces using Grafana
Learn how to unify, correlate, and visualize data with dashboards using Grafana.
Follow this step-by-step tutorial to learn how to configure the OpenTelemetry Operator with your Kubernetes cluster in just 20 minutes.
Read more
Here’s a closer look at some of the latest and greatest features in Grafana Cloud, including k6 browser checks in Synthetic Monitoring and a new...
Read more
With some new additions to our line-up of Enterprise data source plugins, you can now visualize data from Atlassian Statuspage, Cloudflare, and...
Read more
Learn how and when to implement auto-remediation to respond to incidents faster with Grafana Cloud and Grafana IRM.
Read more
On the heels of the ObservabilityCON 2024 keynote, we have no shortage of Grafana Cloud updates to share this month.
Read more
The Explore apps suite for Grafana lets you gain insights into your data via a simple, intuitive, and completely queryless user experience.
Read more
All the latest updates announced at ObservabilityCON 2024 to simplify observability, save time and resources, and bring sophisticated new capabilities...
Read more
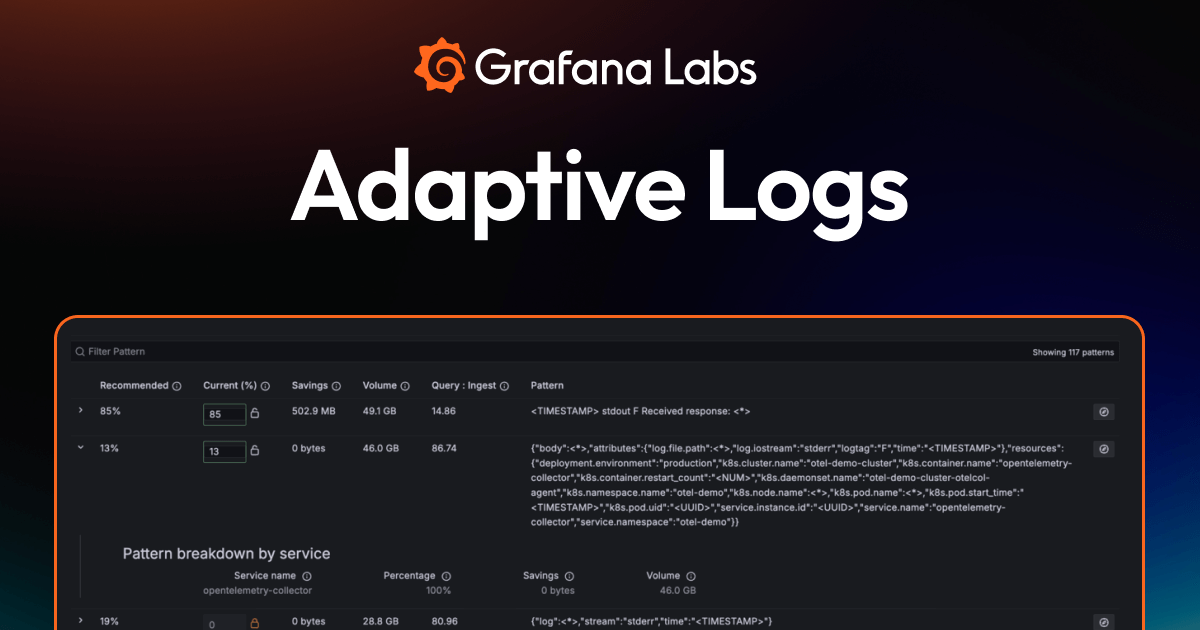
Adaptive Logs, a new Grafana Cloud feature, helps you lower your observability costs and cut down on noise by reducing the volume of unnecessary logs.
Read more
A new suite of unified workflows helps automate the correlation of anomalies across infrastructure and application layers and provides a more cohesive...
Read more
Introducing the Grafana Labs Startup Program, which offers up to $100,000 in Grafana Cloud credits to eligible startups for 12 months or until their...
Read more
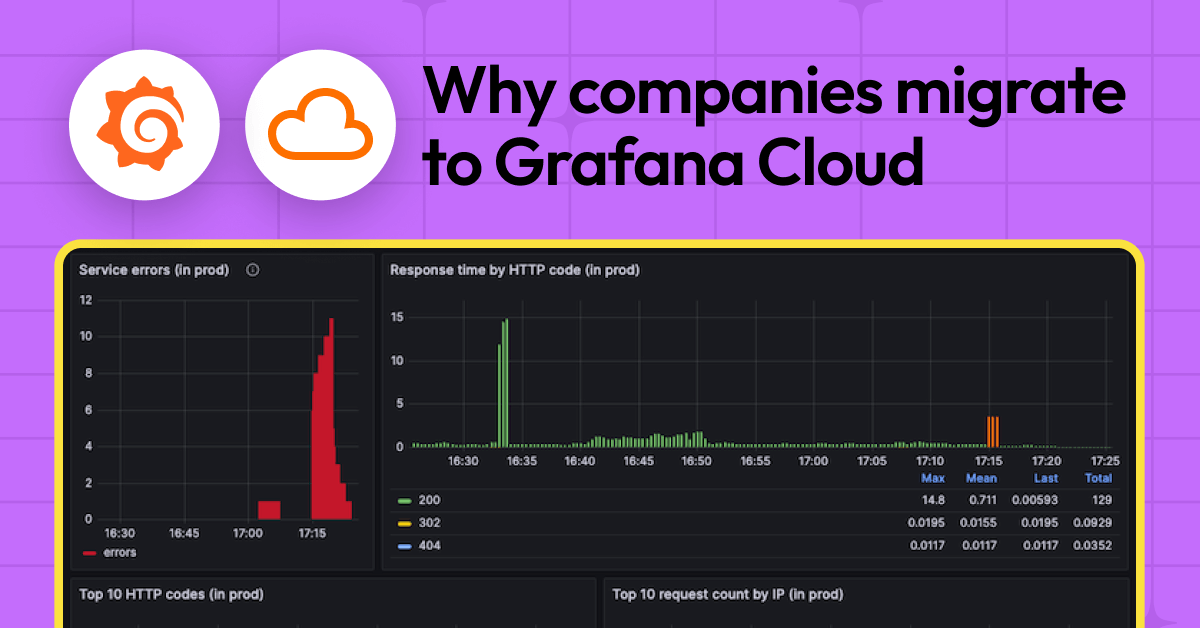
From cost savings to faster troubleshooting, here’s a look at some top reasons organizations decide to migrate to Grafana Cloud.
Read more
Default to isolation in Grafana while maintaining the ability to add optional sharing. Learn how to set up a streamlined system for managing user...
Read more
This year, we added Catchpoint, PagerDuty, and Amazon DynamoDB as Enterprise data sources for Grafana. Here’s how to get started.
Read more
With Grafana Cloud solutions, you get an observability stack for your infrastructure — including preconfigured dashboards and alerts — up and running...
Read more
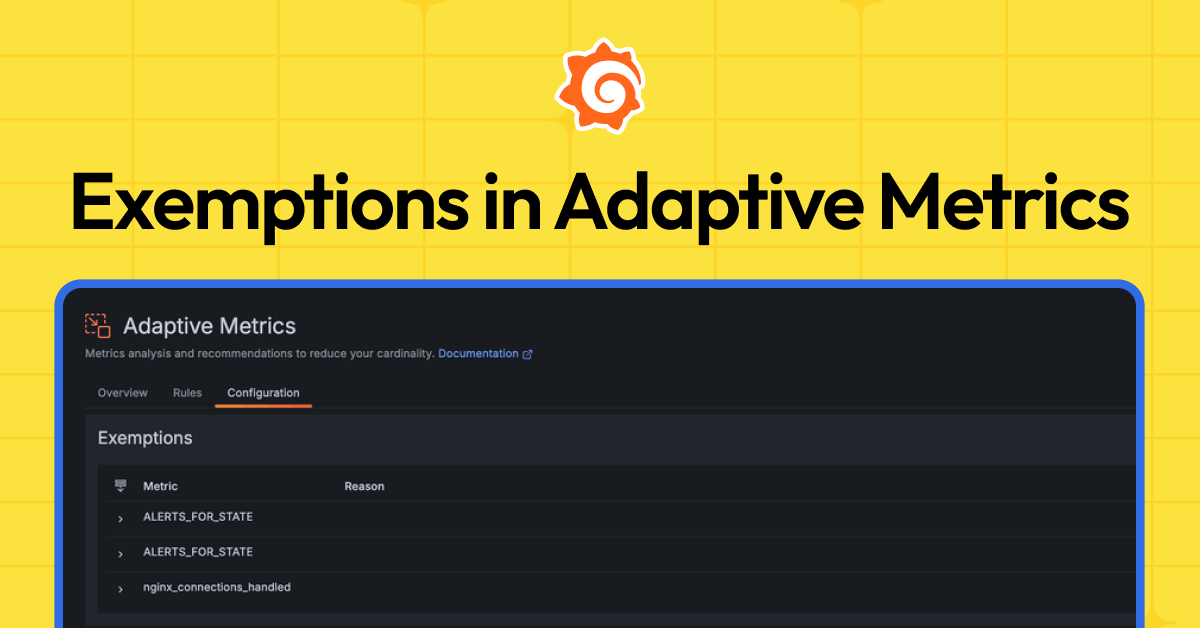
With Exemptions, you can customize how Adaptive Metrics handles your data, ensuring that essential information is always available while enjoying the...
Read more