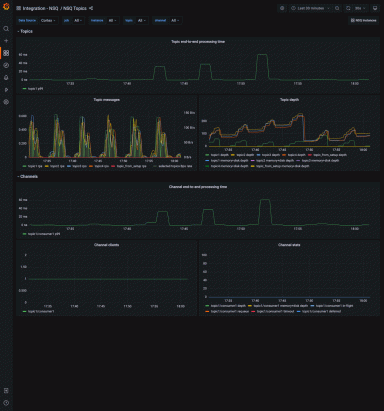
Monitor real-time distributed messaging platform NSQ with the new integration for Grafana Cloud
The NSQ integration for Grafana Cloud helps monitor the real-time distributed messaging platform at scale.
Read more
The NSQ integration for Grafana Cloud helps monitor the real-time distributed messaging platform at scale.
Read more
Learn how Grafana Loki, Grafana Tempo, and Grafana have saved the blockchain gaming studio time (and headaches), allows for proactive problem-solving,...
Read more
Learn more about the Promtail Kafka Consumer and how you can get started with sending Kafka messages to Grafana Loki.
Read more
Exemplars in Grafana Cloud Metrics allow users to seamlessly jump from metrics to traces at cloud native scale
Read more
In our February webinars, Grafana Labs pros provide the basics and best practices for observability, on-call management, distributed tracing, and...
Read more
You can uncover new business opportunities by turning your logs into metrics with Istio and Grafana Cloud.
Read more
Grafana OnCall is an easy-to-use on-call management tool tailored to help developers resolve incidents faster.
Read more
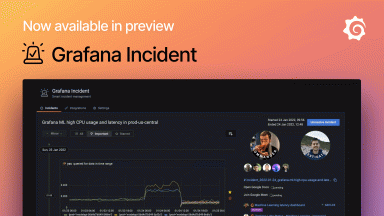
Grafana Labs announced a new incident management tool available in preview for Grafana Cloud users.
Read more
Use the traceroute feature in the Synthetic Monitoring plugin in Grafana Cloud to learn more about what’s happening between your end users and app...
Read more
Grafana Cloud users frequently ask about these five synthetic monitoring alert expressions. Here's how to build alerts for them.
Read more
How one technology company built an effective end-to-end observability solution within weeks with Grafana Cloud.
Read more
Bring together your QA, infrastructure, and application metrics during performance testing with the k6 Cloud app plugin for Grafana.
Read more
In 2021, we introduced the easiest version of Grafana Loki to use yet as well as Grafana Enterprise Logs for the Grafana Enterprise Stack.
Read more
Grafana 8.0 released, unified alerting, new panels and panel suggestions, 22 new plugins, and more ways Grafana has grown and improved in 2021.
Read more
Releases, products, community stories, and announcements that defined an incredible year for Grafana Labs.
Read more
