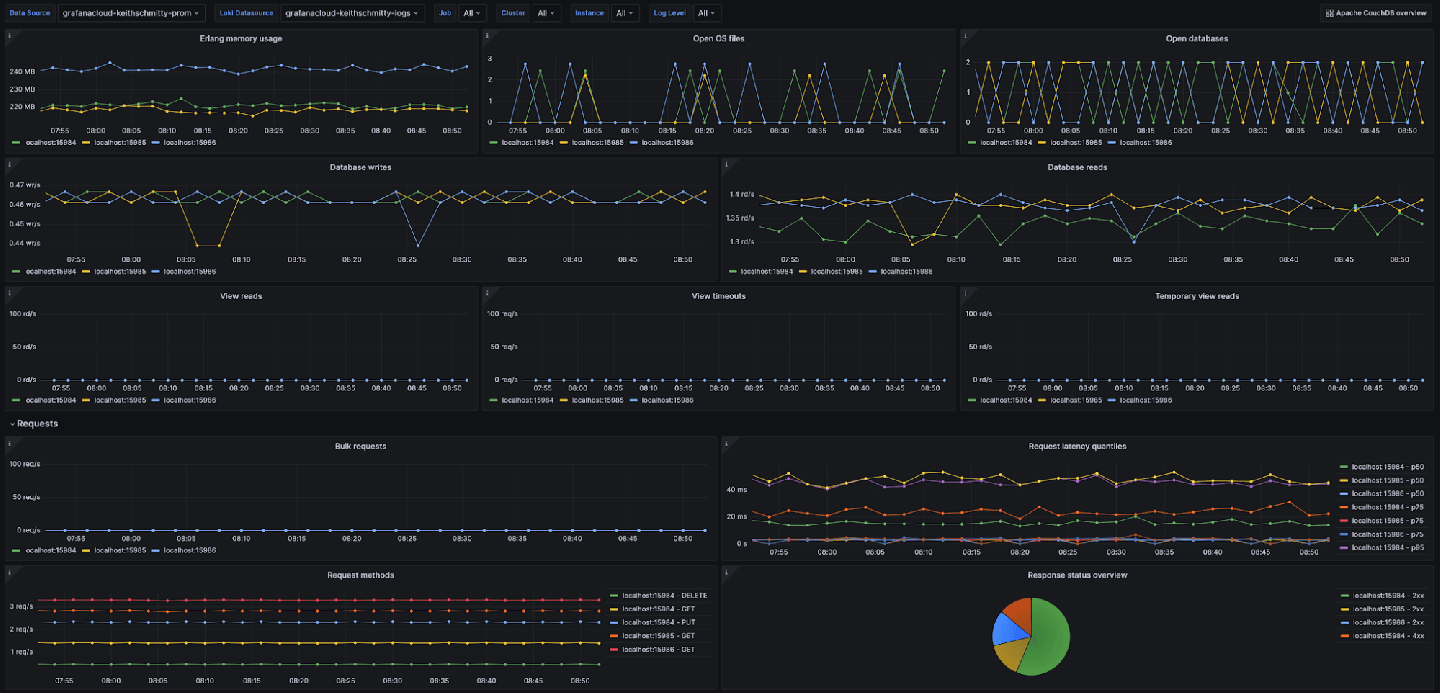
How to monitor an Apache CouchDB cluster with Grafana Cloud
Read more
Products
Grafana Cloud
Monitor, analyze, and act faster with AI-powered observability.
LGTM+ Stack
Key Capabilities
Observability Solutions
end-to-end solutions
Opinionated solutions that help you get there easier and faster
monitor infrastructure
Out-of-the-box KPIs, dashboards, and alerts for observability
visualize any data
Instantly connect all your data sources to Grafana
Grafana Cloud
Monitor, analyze, and act faster with AI-powered observability.
The actually useful free plan
10k series Prometheus metrics
50GB logs, 50GB traces, 50GB profiles
500VUh k6 testing
20+ Enterprise data source plugins
100+ pre-built solutions
Opinionated solutions that help you get there easier and faster
Instantly connect all your data sources to Grafana
Getting started with managing your metrics, logs, and traces using Grafana
Learn how to unify, correlate, and visualize data with dashboards using Grafana.
Read more
Our answer to safely monitoring private network data is Private Data Source Connect (PDC), which is available now in public preview in Grafana Cloud...
Read more
Read more
Read more
Whether it's for compliance purposes or to analyze past incidents, use Grafana Cloud Logs Exporter to transfer your logs — for free! — to your own...
Read more
Grafana Cloud Profiles enables teams to understand how efficiently they are using resources and correlate profiles with metrics, logs, and traces.
Read more
Read more
Read more
Read more
Read more
Read more
Read more
Read more
Read more
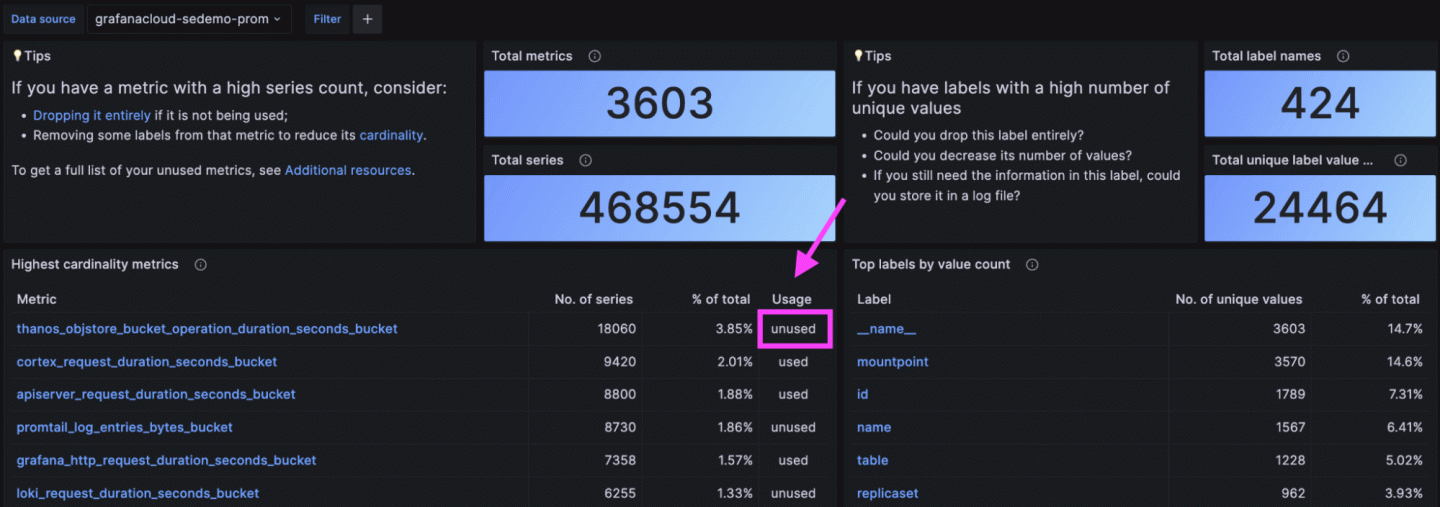
How to find and cut costly, unused metrics in Grafana Cloud with Cardinality Management dashboards.
Read more