Introducing Grafana OnCall shift swaps: A simpler way to exchange on-call shifts with teammates
The new Grafana OnCall shift swaps feature makes it easier than ever for engineers to coordinate with teammates and exchange on-call shifts.
Read more
Products
Grafana Cloud
Monitor, analyze, and act faster with AI-powered observability.
LGTM+ Stack
Key Capabilities
Observability Solutions
end-to-end solutions
Opinionated solutions that help you get there easier and faster
monitor infrastructure
Out-of-the-box KPIs, dashboards, and alerts for observability
visualize any data
Instantly connect all your data sources to Grafana
Grafana Cloud
Monitor, analyze, and act faster with AI-powered observability.
The actually useful free plan
10k series Prometheus metrics
50GB logs, 50GB traces, 50GB profiles
500VUh k6 testing
20+ Enterprise data source plugins
100+ pre-built solutions
Opinionated solutions that help you get there easier and faster
Instantly connect all your data sources to Grafana
Getting started with managing your metrics, logs, and traces using Grafana
Learn how to unify, correlate, and visualize data with dashboards using Grafana.
The new Grafana OnCall shift swaps feature makes it easier than ever for engineers to coordinate with teammates and exchange on-call shifts.
Read more
The Metrics Endpoint solution is an agentless integration you can use to forward Prometheus metrics from your publicly addressable host directly into...
Read more
Replacing PagerDuty with Grafana's Incident Response and Management suite was a simple decision once Prezi compared the tools' costs, features, and...
Read more
Sift, currently in public preview in Grafana Cloud, performs a set of automated system checks and surfaces potential issues in your Kubernetes...
Read more
In Grafana Loki 2.9, we're adding features to help you better understand your log volume, write more performant queries, and more easily find what you...
Read more
The Grafana OpenTelemetry Starter connects the latest Micrometer enhancements from Spring Boot 3 with Grafana Cloud using OpenTelemetry.
Read more
We are excited to announce that the Grafana IRM chatbot in Grafana Cloud can now support Microsoft Teams, which will help streamline incident...
Read more
Take your AWS observability to the next level with Grafana Cloud. We now have support for over 60 AWS services, including EC2, Lambda, EBS, RDS, S3,...
Read more
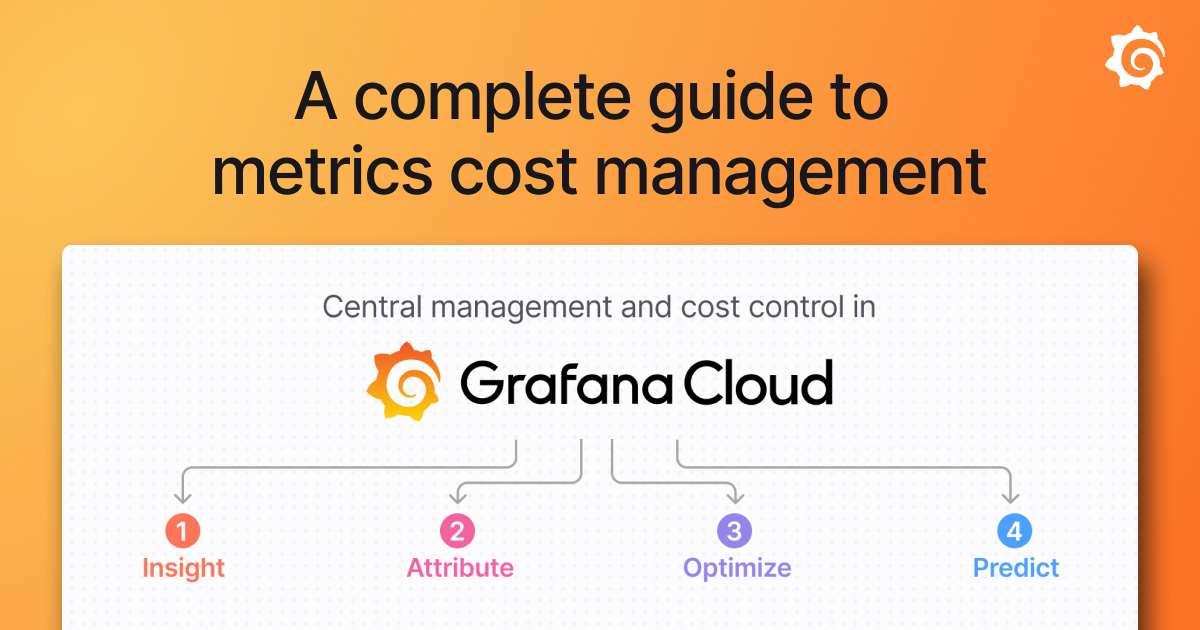
Grafana Cloud offers a wide range of tools to help manage and control your metrics costs. Here is a breakdown of what they are and how they help.
Read more
Correlating continuous profiles with metrics, logs, and traces in the Grafana Cloud observability stack gives teams new ways to improve application...
Read more
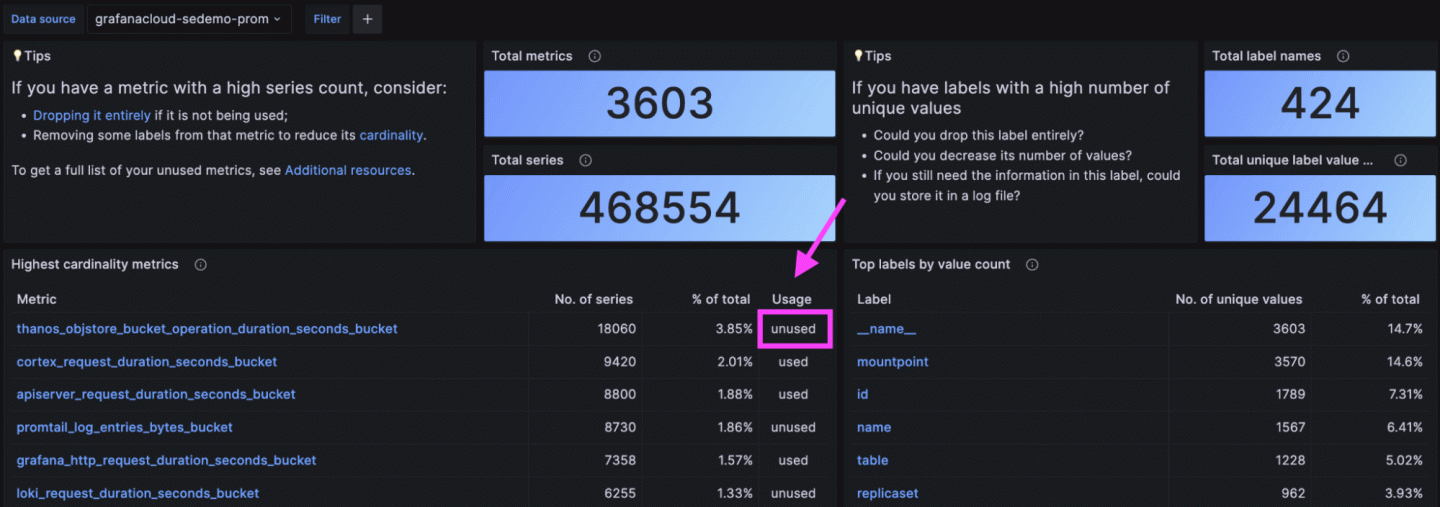
Curious to try Adaptive Metrics? Here are some common questions users have when first trying the new metrics management tool in Grafana Cloud.
Read more
Grafana Cloud Free is the best way to run our software and understand its full capabilities.
Read more
with the release of Grafana 10.0, we have introduced a new user interface that simplifies the configuration of SAML authentication for your Grafana...
Read more
We're making it even easier to identify potential savings in your observability bill, with a brand new Adaptive Metrics UX that introduces a new...
Read more
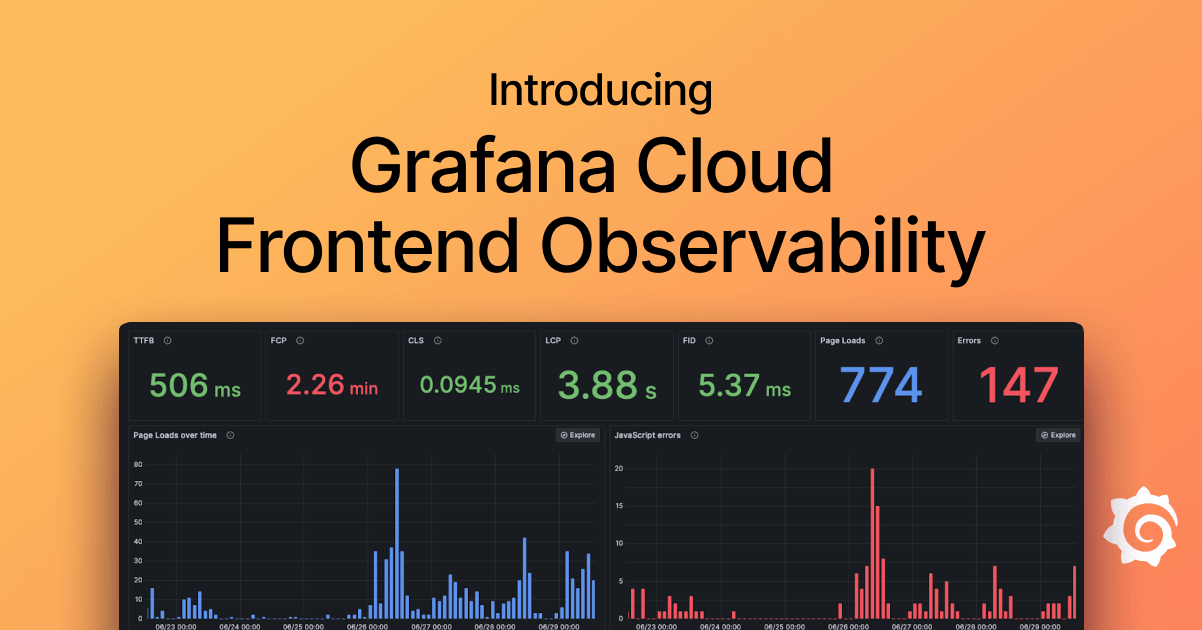
Grafana Cloud Frontend Observability gives you an in-depth look at the real user experience on your application.
Read more