How to set up home automation: A beginner's guide with Grafana Cloud and Home Assistant
Find out how to use Grafana Cloud to visualize and monitor your home with smart devices.
Read more
Products
Grafana Cloud
Monitor, analyze, and act faster with AI-powered observability.
LGTM+ Stack
Key Capabilities
Observability Solutions
end-to-end solutions
Opinionated solutions that help you get there easier and faster
monitor infrastructure
Out-of-the-box KPIs, dashboards, and alerts for observability
visualize any data
Instantly connect all your data sources to Grafana
Grafana Cloud
Monitor, analyze, and act faster with AI-powered observability.
The actually useful free plan
10k series Prometheus metrics
50GB logs, 50GB traces, 50GB profiles
500VUh k6 testing
20+ Enterprise data source plugins
100+ pre-built solutions
Opinionated solutions that help you get there easier and faster
Instantly connect all your data sources to Grafana
Getting started with managing your metrics, logs, and traces using Grafana
Learn how to unify, correlate, and visualize data with dashboards using Grafana.
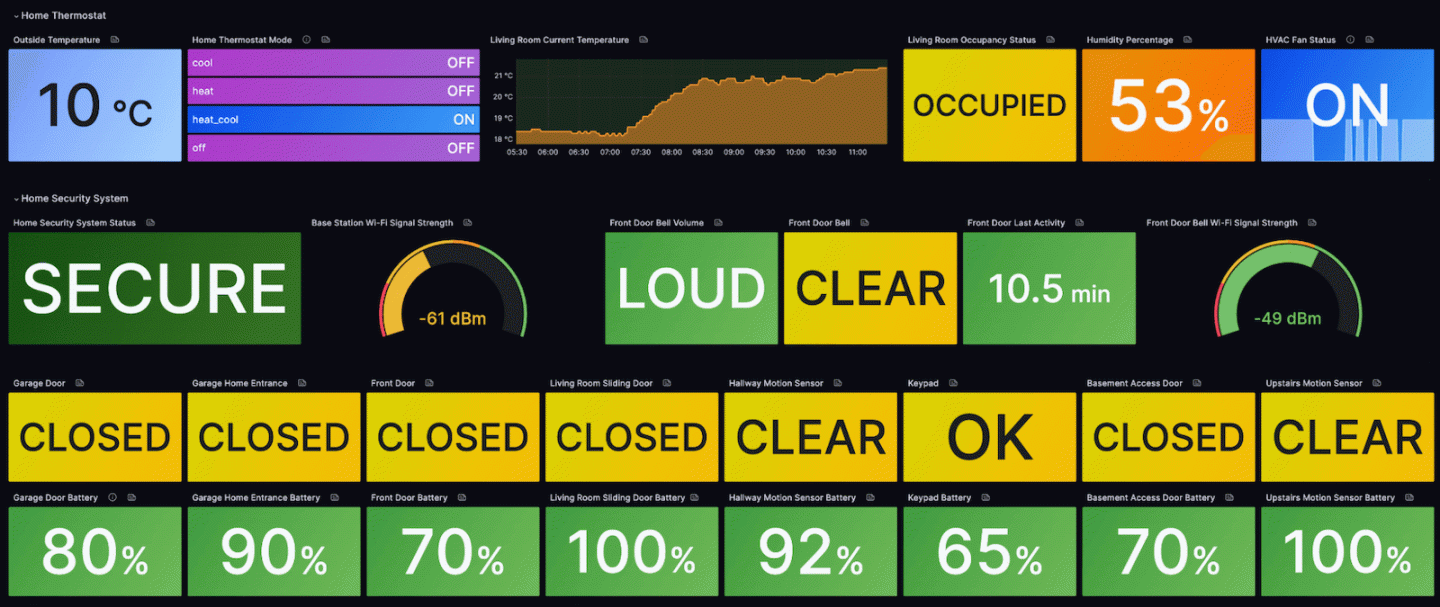
Find out how to use Grafana Cloud to visualize and monitor your home with smart devices.
Read more
Check out some of the biggest updates we made to Grafana Cloud in 2023. From infrastructure to applications, we're making observability easier and...
Read more
Notify other users or teams directly through Grafana OnCall or Grafana Incident so you can more easily pull them into your incident response.
Read more
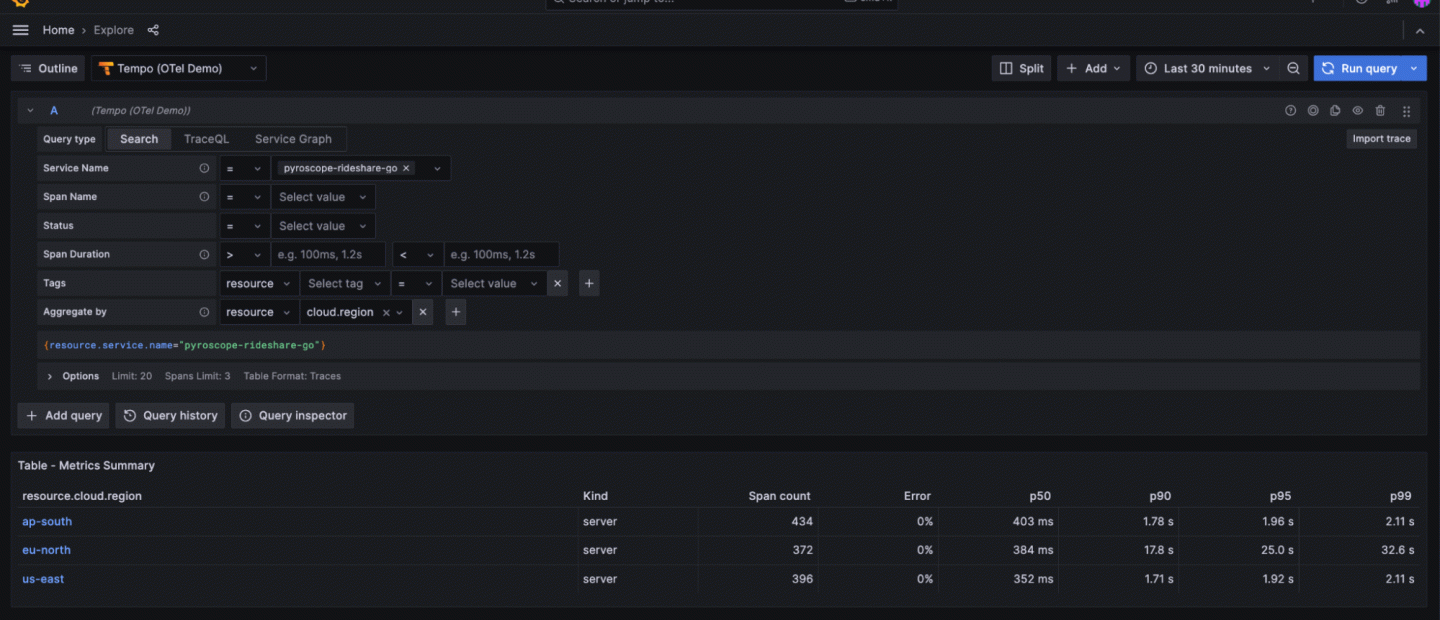
Looking to get more value out of tracing? We’ve added the ability to compute RED metrics from recent trace data grouped by any attribute of your...
Read more
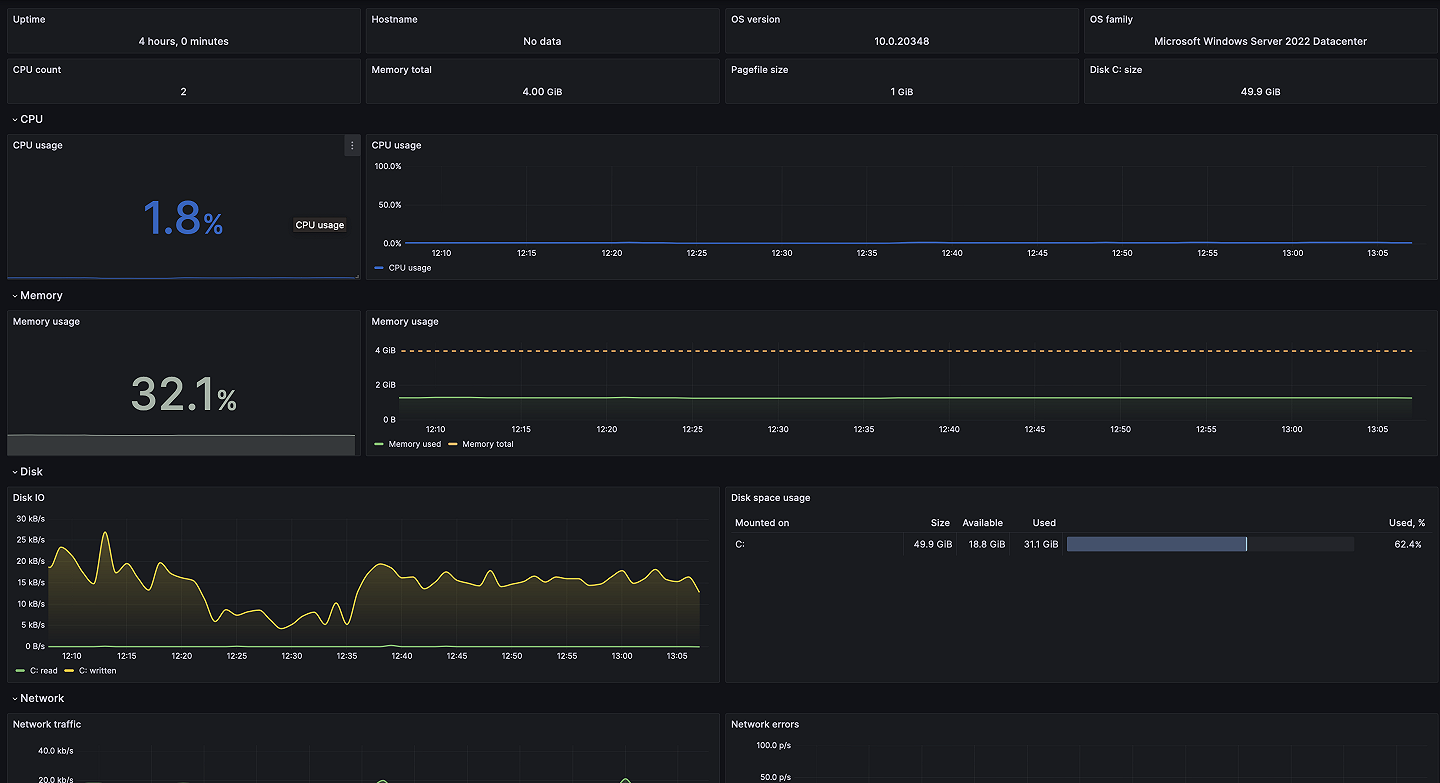
We've released a major update for Windows, our most popular integration. Use new dashboards, alerts, and annotations for nodes and fleets — all with...
Read more
Debating between OSS vs. a full-managed solution for logging? Here's why observability pros ultimately decided on Grafana Cloud
Read more
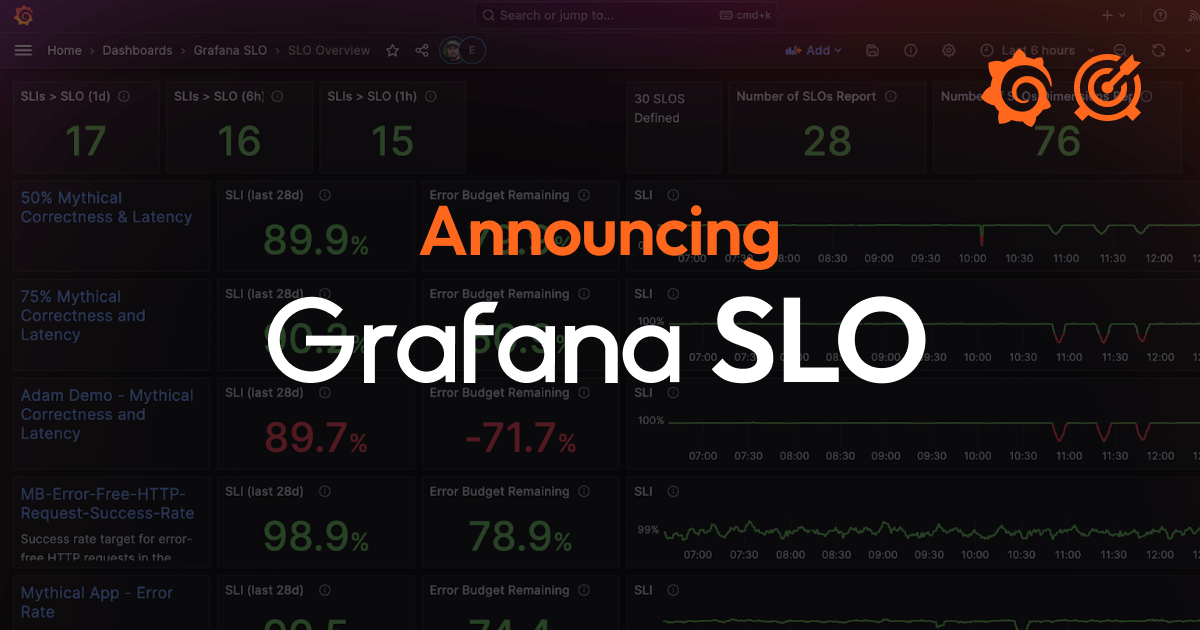
Grafana SLO makes it easy to create, manage, and scale service level objectives, SLO dashboards, and error budget alerts in Grafana Cloud.
Read more
Grafana Labs' acquisition of Asserts.ai will bring to Grafana Cloud the ability to more easily explore your telemetry and derive new insights for more...
Read more
Grafana Cloud brings you new and improved cost management features for your metrics, logs, and monthly bills.
Read more
The latest developments in Kubernetes Monitoring in Grafana Cloud
Read more
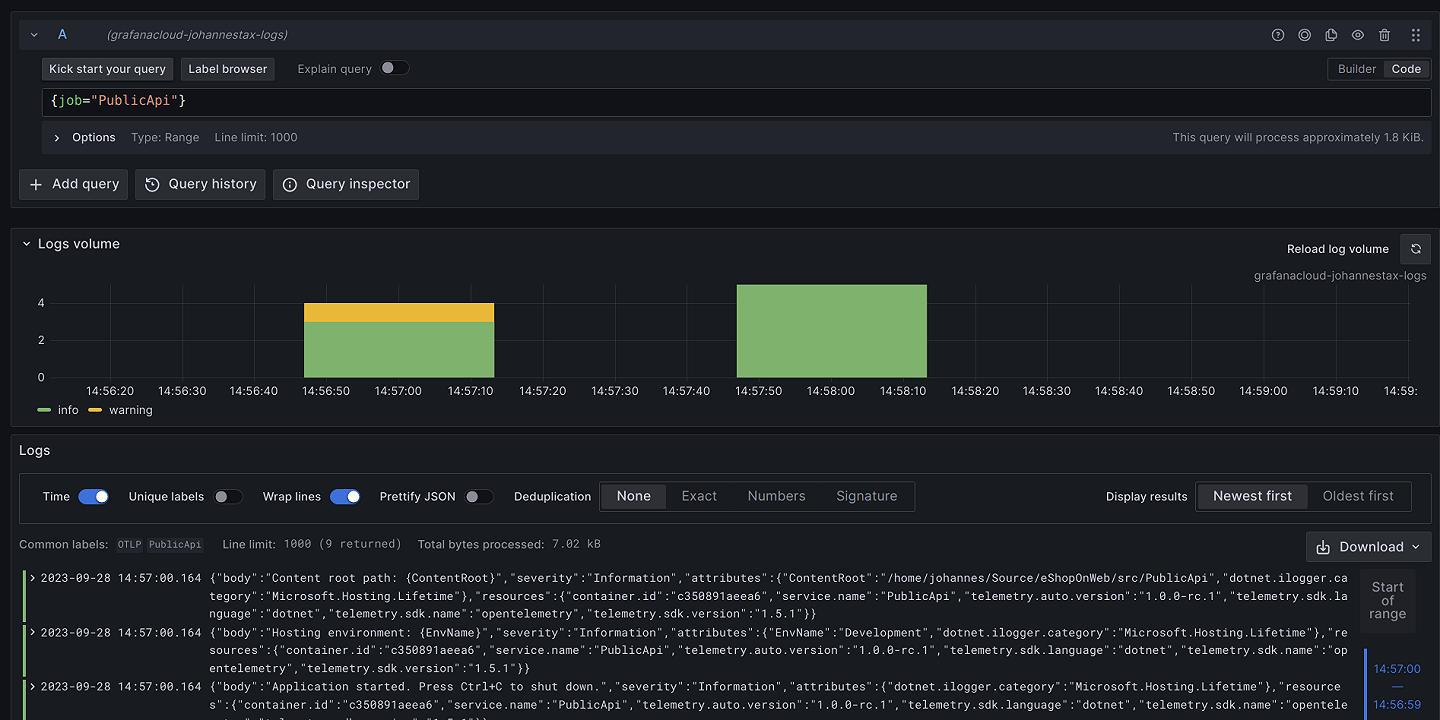
OpenTelemetry's .NET automatic instrumentation makes it easy to collect metrics, logs, and traces from your applications and visualize your OTel...
Read more
Grafana 10.2 delivers exciting new visualization capabilities, AI assistance with dashboard titles, and more
Read more
The dynamic nature of Kubernetes workloads can lead to unexpected costs if you don't manage your resources efficiently. Follow these best practices to...
Read more
You can now use AWS PrivateLink to establish a secure connection between your virtual private cloud (VPC) network and Grafana Cloud for all your data....
Read more
With Private Data Source Connect, Grafana Cloud users can now query data in multiple private networks through a secure link.
Read more