• Products Open Source Solutions Learn Docs Pricing
  • Downloads Contact us Sign in
Create free account Contact us

Products

Grafana Cloud

Monitor, analyze, and act faster with AI-powered observability.

Grafana Cloud
Grafana Cloud overview

LGTM+ Stack

Grafana Cloud Logs

Logs

powered by Grafana Loki

Grafana

Grafana

for visualization

Grafana Cloud Traces

Traces

powered by Grafana Tempo

Grafana Cloud Metrics

Metrics

powered by Grafana Mimir and Prometheus

Key Capabilities

AI/ML

AI/ML insights

Identify anomalies and reduce toil

Grafana Cloud Asserts

Contextual root cause analysis

Automated anomaly correlation

Grafana SLO

SLO management

Create SLOs and error budget alerts

Grafana Alerting

Alerting

Trigger alerts from any data source

Plugins

Plugins

Connect Grafana to data sources, apps, and more

Observability Solutions

Application Observability

Application Observability

Monitor application performance

Infrastructure Observability

Infrastructure observability

Ensure infrastructure health and performance

Testing

Grafana Cloud k6

Performance testing

Powered by Grafana k6

Synthetic Monitoring

Synthetic Monitoring

powered by Grafana k6

IRM

Incident

Incident response

Routine task automation for incidents

OnCall

On-call management

Flexible on-call management

Open Source

Grafana Loki

Multi-tenant log aggregation system

Grafana

Query, visualize, and alert on data

Grafana Tempo

High-scale distributed tracing backend

Grafana Mimir

Scalable and performant metrics backend

Grafana Pyroscope

Scalable continuous profiling backend

Grafana Beyla

eBPF auto-instrumentation

Grafana Faro

Frontend application observability web SDK

Grafana Alloy

OpenTelemetry Collector distribution with Prometheus pipelines

Grafana k6

Load testing for engineering teams

Prometheus

Monitor Kubernetes and cloud native

OpenTelemetry

Instrument and collect telemetry data

Graphite

Scalable monitoring for time series data

All

Community resources

Dashboard templates

Try out and share prebuilt visualizations

Prometheus exporters

Get your metrics into Prometheus quickly

end-to-end solutions

Opinionated solutions that help you get there easier and faster

Kubernetes Monitoring

Get K8s health, performance, and cost monitoring from cluster to container

Application Observability

Monitor application performance

Frontend Observability

Gain real user monitoring insights

Incident Response & Management

Detect and respond to incidents with a simplified workflow

All monitoring and visualization solutions

monitor infrastructure

Out-of-the-box KPIs, dashboards, and alerts for observability

linux server logo
Linux
windows logo
Windows
docker logo
Docker
postgresql logo
Postgres
mysql logo
MySQL
aws logo
AWS
kafka logo
Kafka
jenkins logo
Jenkins
rabbitmq logo
RabbitMQ
mongodb logo
MongoDB
microsoft azure observability logo
Microsoft Azure
google cloud observability with grafana cloud logo
Google Cloud
All monitoring solutions

visualize any data

Instantly connect all your data sources to Grafana

mongodb logo
MongoDB
appdynamics logo
AppDynamics
oracle database logo
Oracle
gitlab logo
GitLab
jira logo
Jira
salesforce logo
Salesforce
splunk logo
Splunk
datadog logo
Datadog
new relic logo
New Relic
snowflake logo
Snowflake
All visualization solutions

Learn

Community and events

Events

Upcoming in-person and virtual events

ObservabilityCON 2025 (7-9 Oct)

Our flagship observability event

GrafanaCON 2025

Our annual OSS community conference

ObservabilityCON on the Road

Our observability conference on the road

Community

Join the Grafana community

Community forums

Ask the community for help

Resources

Blog

News, releases, cool stories, and more

4th annual Observability Survey

Share your thoughts on the state of observability

Benefits of Observability

New research, reports, and insights

Success stories

By use case, product, and industry

How-to

Documentation

All the docs

Webinars and videos

Demos, webinars, and feature tours

Tutorials

Step-by-step guides

Workshops

Free, in-person or online

Learning Journeys

Expert guidance for mastering our platform

Professional Services

Expert guidance and training

Docs
Pricing

Help build the future of open source observability software Open positions

Check out the open source projects we support Downloads

Sign in

Grafana Cloud

Monitor, analyze, and act faster with AI-powered observability.

Grafana Cloud
Grafana Cloud overview

LGTM+ Stack

Grafana Cloud Logs

Logs

Grafana

Grafana

Grafana Cloud Traces

Traces

Grafana Cloud Metrics

Metrics

Key Capabilities

AI/ML

AI/ML insights

Grafana Cloud Asserts

Contextual root cause analysis

Grafana SLO

SLO management

Grafana Alerting

Alerting

Plugins

Plugins

Observability Solutions

Application Observability

Application Observability

Infrastructure Observability

Infrastructure observability

Testing

Grafana Cloud k6

Performance testing

Synthetic Monitoring

Synthetic Monitoring

IRM

Incident

Incident response

OnCall

On-call management

The actually useful free plan

Grafana Cloud Free Tier
check

10k series Prometheus metrics

check

50GB logs, 50GB traces, 50GB profiles

check

500VUk k6 testing

check

20+ Enterprise data source plugins

check

100+ pre-built solutions

Create account
Grafana Cloud Logs

Grafana Loki

Multi-tenant log aggregation system

Grafana

Grafana

Query, visualize, and alert on data

Grafana Cloud Traces

Grafana Tempo

High-scale distributed tracing backend

Grafana Cloud Metrics

Grafana Mimir

Scalable and performant metrics backend

Grafana Cloud Profiles

Grafana Pyroscope

Scalable continuous profiling backend

Grafana Beyla

eBPF auto-instrumentation

Grafana Faro

Grafana Faro

Frontend application observability web SDK

Grafana Alloy

Grafana Alloy

OpenTelemetry Collector distribution with Prometheus pipelines

Grafana Cloud k6

Grafana k6

Load testing for engineering teams

Prometheus

Prometheus

Monitor Kubernetes and cloud native

OpenTelemetry

OpenTelemetry

Instrument and collect telemetry data

Graphite

Graphite

Scalable monitoring for time series data

All

Community resources

Dashboard templates
Try out and share prebuilt visualizations
Prometheus exporters
Get your metrics into Prometheus quickly

end-to-end solutions

Opinionated solutions that help you get there easier and faster

Kubernetes Monitoring

Kubernetes Monitoring

Get K8s health, performance, and cost monitoring from cluster to container

Application Observability

Application Observability

Monitor application performance

Frontend Observability

Frontend Observability

Gain real user monitoring insights

Incident Response & Management

Incident Response & Management

Detect and respond to incidents with a simplified workflow

monitor infrastructure

Out-of-the-box KPIs, dashboards, and alerts for observability

linux server logo Linux
windows logo Windows
docker logo Docker
postgresql logo Postgres
mysql logo MySQL
aws logo AWS
kafka logo Kafka
jenkins logo Jenkins
rabbitmq logo RabbitMQ
mongodb logo MongoDB
microsoft azure observability logo Microsoft Azure
google cloud observability with grafana cloud logo Google Cloud

visualize any data

Instantly connect all your data sources to Grafana

mongodb logo MongoDB
appdynamics logo AppDynamics
oracle database logo Oracle
gitlab logo GitLab
jira logo Jira
salesforce logo Salesforce
splunk logo Splunk
datadog logo Datadog
new relic logo New Relic
snowflake logo Snowflake
All monitoring and visualization solutions

Community and events

Events

ObservabilityCON 2025 (7-9 Oct)

GrafanaCON 2025

ObservabilityCON on the Road

Community

Community forums

Resources

Blog

4th annual Observability Survey

Benefits of Observability

Success stories

How-to

Documentation

Webinars and videos

Tutorials

Workshops

Learning Journeys

Professional Services

Featured webinar

Getting started with grafana LGTM stack

Getting started with managing your metrics, logs, and traces using Grafana

Learn how to unify, correlate, and visualize data with dashboards using Grafana.

Learn more →
Try using Grot AI Grot AI for this query ->
Blog
  • All
  • Community
  • Culture
  • Engineering
  • News
  • Release
Blog
  • All
  • Community
  • Culture
  • Engineering
  • News
  • Release
Tags

Events

View all tags
Don't miss our upcoming webinars on logging with Grafana Loki for APAC and EMEA

Grafana Labs Team   ·   4 Oct 2021   ·   2 min read

Don't miss our upcoming webinars on logging with Grafana Loki for APAC and EMEA

Loki
Events

Read more


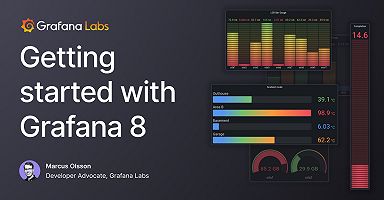
Don't miss the live webinar on getting started with Grafana 8 at 8:00 UTC on Sept. 9

Grafana Labs Team   ·   8 Sep 2021   ·   1 min read

Don't miss the live webinar on getting started with Grafana 8 at 8:00 UTC on Sept. 9

Events
Grafana
Prometheus
Loki

Read more


Grafana ObservabilityCON is returning November 8-10!

Sam Coren   ·   1 Sep 2021   ·   2 min read

Grafana ObservabilityCON is returning November 8-10!

Events
Observability

Read more


GrafanaCONline Day 6 recap: The latest on Loki for logs, Grafana for monitoring high performance computing, the business of Grafana Labs, and more!

Grafana Labs Team   ·   21 Jun 2021   ·   6 min read

GrafanaCONline Day 6 recap: The latest on Loki for logs, Grafana for monitoring high performance...

Events

Read more


GrafanaCONline IoT Day recap: Real-time streaming in Grafana 8, fun DIY projects, Grafana for trains, plants, and more

Grafana Labs Team   ·   16 Jun 2021   ·   6 min read

GrafanaCONline IoT Day recap: Real-time streaming in Grafana 8, fun DIY projects, Grafana for...

Events

Read more


GrafanaCONline 2021 Day 3 recap: Grafana Tempo deep dive, plus how Grafana helps grow e-commerce, scale NFT platforms, and more!

Grafana Labs Team   ·   15 Jun 2021   ·   5 min read

GrafanaCONline 2021 Day 3 recap: Grafana Tempo deep dive, plus how Grafana helps grow e-commerce,...

Events
Tempo
Grafana Cloud
Grafana Agent
AWS
Tanka

Read more


GrafanaCONline Day 2 recap: Grafana 8 deep dive, Prometheus innovation, a billion time series at Robinhood, and more

Grafana Labs Team   ·   10 Jun 2021   ·   5 min read

GrafanaCONline Day 2 recap: Grafana 8 deep dive, Prometheus innovation, a billion time series at...

Events

Read more


GrafanaCONline 2021: Know before you go!

Ryan Geyer   ·   2 Jun 2021   ·   2 min read

GrafanaCONline 2021: Know before you go!

Events
GrafanaCon

Read more


Grafana Labs at SLOConf: All the details

Grafana Labs Team   ·   17 May 2021   ·   3 min read

Grafana Labs at SLOConf: All the details

Grafana Labs team members discuss service level objectives at SLOConf 2021.

Events

Read more


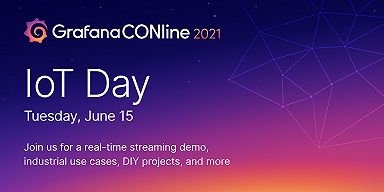
Join us for IoT Day at GrafanaCONline: Real-time streaming demo, industrial use cases, DIY projects, and more

Ryan McKinley   ·   14 May 2021   ·   2 min read

Join us for IoT Day at GrafanaCONline: Real-time streaming demo, industrial use cases, DIY projects,...

IoT
Grafana
Events
GrafanaCon

Read more


Introducing the GrafanaCONline 2021 lineup

Grafana Labs Team   ·   6 May 2021   ·   2 min read

Introducing the GrafanaCONline 2021 lineup

The June 7-17 virtual conference will feature 30+ deep dives, demos, and end user stories about Grafana, Loki, Tempo, Prometheus, and more!

Events
GrafanaCon

Read more


KubeCon + CloudNativeCon Europe 2021 preview: Grafana Labs team members talk about Cortex, Prometheus, observability, and distributed tracing

Grafana Labs Team   ·   3 May 2021   ·   3 min read

KubeCon + CloudNativeCon Europe 2021 preview: Grafana Labs team members talk about Cortex,...

Events
Mimir
Prometheus
Jaeger
Observability
KubeCon

Read more


Join us at Kubernetes Community Days Africa on April 29

Uchechukwu Obasi   ·   6 Apr 2021   ·   2 min read

Join us at Kubernetes Community Days Africa on April 29

Events
Kubernetes

Read more


Save the dates! GrafanaCONline returns June 7-17, CFP is open now

Torkel Ödegaard   ·   16 Mar 2021   ·   2 min read

Save the dates! GrafanaCONline returns June 7-17, CFP is open now

Events
GrafanaCon

Read more


Don't miss our new series of live demo webinars kicking off March 4: Getting started with Grafana and observability

Grafana Labs Team   ·   1 Mar 2021   ·   1 min read

Don't miss our new series of live demo webinars kicking off March 4: Getting started with Grafana...

Events
Observability
Loki
Prometheus

Read more


  • ««
  • «
  • 4
  • 5
  • 6
  • 7
  • 8
  • »
  • »»
Sign up for Grafana stack updates
Note: By signing up, you agree to be emailed related product-level information.


Products
  • Grafana Cloud
  • Grafana Enterprise Stack
  • Grafana visualizations
  • Plugins
  • Grafana Cloud Logs
  • Grafana Cloud Metrics
  • Grafana Cloud Traces
  • Grafana Cloud Profiles
  • AI/ML tools for observability
  • Application Observability
  • Frontend Observability
  • Grafana Cloud Asserts
  • Grafana IRM
  • Grafana k6
  • Grafana SLO
  • Synthetic Monitoring
  • Solutions
  • Pricing
Open Source
  • Grafana
  • Grafana Alloy
  • Grafana Beyla
  • Grafana Faro
  • Grafana k6
  • Grafana Loki
  • Grafana Mimir
  • Grafana OnCall
  • Grafana Pyroscope
  • Grafana Tanka
  • Grafana Tempo
  • Graphite
  • OpenTelemetry
  • Prometheus
  • Dashboard templates
  • Downloads
  •   GitHub
Learn
  • Documentation
  • Grafana Labs blog
  • Webinars and videos
  • Tutorials
  • Workshops
  • Events
  • Community
  • Professional Services
  • Community forums
  • Community Slack
  • Grafana Champions
  • Community organizers
  • Observability Survey Report 2025
  • OSS vs Cloud
  • Writers' Toolkit
  • Plugin development
  • Load testing
  • OpenTelemetry Report
  • Log monitoring
Company
  • Partnerships
  • Our team
  • Careers
  • Success stories
  • Newsroom
  • Contact us
  • Getting help
  • Merch
  • Open positions We're hiring
  • The Story of Grafana
Compare
  • Grafana vs. Datadog
Localized content
  • Japanese pages
  • German pages
  • French pages
  • Spanish pages
  • Portuguese pages

  • Grafana Cloud status
  • Legal and Security
  • Terms of Service
  • Privacy Policy
  • Trademark Policy
Copyright 2025 © Grafana Labs
Grafana Labs uses cookies for the normal operation of this website. Learn more.