• Products Open Source Solutions Learn Docs Pricing
  • Downloads Contact us Sign in
Create free account Contact us

Products

Grafana Cloud

Monitor, analyze, and act faster with AI-powered observability.

Grafana Cloud
Grafana Cloud overview

LGTM+ Stack

Grafana Cloud Logs

Logs

powered by Grafana Loki

Grafana

Grafana

for visualization

Grafana Cloud Traces

Traces

powered by Grafana Tempo

Grafana Cloud Metrics

Metrics

powered by Grafana Mimir and Prometheus

Key Capabilities

AI/ML

AI/ML insights

Identify anomalies and reduce toil

Grafana Cloud Asserts

Contextual root cause analysis

Automated anomaly correlation

Grafana SLO

SLO management

Create SLOs and error budget alerts

Grafana Alerting

Alerting

Trigger alerts from any data source

Plugins

Plugins

Connect Grafana to data sources, apps, and more

Observability Solutions

Application Observability

Application Observability

Monitor application performance

Infrastructure Observability

Infrastructure observability

Ensure infrastructure health and performance

Testing

Grafana Cloud k6

Performance testing

Powered by Grafana k6

Synthetic Monitoring

Synthetic Monitoring

powered by Grafana k6

IRM

Incident

Incident response

Routine task automation for incidents

OnCall

On-call management

Flexible on-call management

Open Source

Grafana Loki

Multi-tenant log aggregation system

Grafana

Query, visualize, and alert on data

Grafana Tempo

High-scale distributed tracing backend

Grafana Mimir

Scalable and performant metrics backend

Grafana Pyroscope

Scalable continuous profiling backend

Grafana Beyla

eBPF auto-instrumentation

Grafana Faro

Frontend application observability web SDK

Grafana Alloy

OpenTelemetry Collector distribution with Prometheus pipelines

Grafana k6

Load testing for engineering teams

Prometheus

Monitor Kubernetes and cloud native

OpenTelemetry

Instrument and collect telemetry data

Graphite

Scalable monitoring for time series data

All

Community resources

Dashboard templates

Try out and share prebuilt visualizations

Prometheus exporters

Get your metrics into Prometheus quickly

end-to-end solutions

Opinionated solutions that help you get there easier and faster

Kubernetes Monitoring

Get K8s health, performance, and cost monitoring from cluster to container

Application Observability

Monitor application performance

Frontend Observability

Gain real user monitoring insights

Incident Response & Management

Detect and respond to incidents with a simplified workflow

All monitoring and visualization solutions

monitor infrastructure

Out-of-the-box KPIs, dashboards, and alerts for observability

linux server logo
Linux
windows logo
Windows
docker logo
Docker
postgresql logo
Postgres
mysql logo
MySQL
aws logo
AWS
kafka logo
Kafka
jenkins logo
Jenkins
rabbitmq logo
RabbitMQ
mongodb logo
MongoDB
microsoft azure observability logo
Microsoft Azure
google cloud observability with grafana cloud logo
Google Cloud
All monitoring solutions

visualize any data

Instantly connect all your data sources to Grafana

mongodb logo
MongoDB
appdynamics logo
AppDynamics
oracle database logo
Oracle
gitlab logo
GitLab
jira logo
Jira
salesforce logo
Salesforce
splunk logo
Splunk
datadog logo
Datadog
new relic logo
New Relic
snowflake logo
Snowflake
All visualization solutions

Learn

Community and events

Events

Upcoming in-person and virtual events

ObservabilityCON 2025 (7-9 Oct)

Our flagship observability event

GrafanaCON 2025

Our annual OSS community conference

ObservabilityCON on the Road

Our observability conference on the road

Community

Join the Grafana community

Community forums

Ask the community for help

Resources

Blog

News, releases, cool stories, and more

Observability survey report 2025

Industry insights on the state of observability

Benefits of Observability

New research, reports, and insights

Success stories

By use case, product, and industry

How-to

Documentation

All the docs

Webinars and videos

Demos, webinars, and feature tours

Tutorials

Step-by-step guides

Workshops

Free, in-person or online

Learning Journeys

Expert guidance for mastering our platform

Professional Services

Expert guidance and training

Docs
Pricing

Help build the future of open source observability software Open positions

Check out the open source projects we support Downloads

Sign in

Grafana Cloud

Monitor, analyze, and act faster with AI-powered observability.

Grafana Cloud
Grafana Cloud overview

LGTM+ Stack

Grafana Cloud Logs

Logs

Grafana

Grafana

Grafana Cloud Traces

Traces

Grafana Cloud Metrics

Metrics

Key Capabilities

AI/ML

AI/ML insights

Grafana Cloud Asserts

Contextual root cause analysis

Grafana SLO

SLO management

Grafana Alerting

Alerting

Plugins

Plugins

Observability Solutions

Application Observability

Application Observability

Infrastructure Observability

Infrastructure observability

Testing

Grafana Cloud k6

Performance testing

Synthetic Monitoring

Synthetic Monitoring

IRM

Incident

Incident response

OnCall

On-call management

The actually useful free plan

Grafana Cloud Free Tier
check

10k series Prometheus metrics

check

50GB logs, 50GB traces, 50GB profiles

check

500VUk k6 testing

check

20+ Enterprise data source plugins

check

100+ pre-built solutions

Create account
Grafana Cloud Logs

Grafana Loki

Multi-tenant log aggregation system

Grafana

Grafana

Query, visualize, and alert on data

Grafana Cloud Traces

Grafana Tempo

High-scale distributed tracing backend

Grafana Cloud Metrics

Grafana Mimir

Scalable and performant metrics backend

Grafana Cloud Profiles

Grafana Pyroscope

Scalable continuous profiling backend

Grafana Beyla

eBPF auto-instrumentation

Grafana Faro

Grafana Faro

Frontend application observability web SDK

Grafana Alloy

Grafana Alloy

OpenTelemetry Collector distribution with Prometheus pipelines

Grafana Cloud k6

Grafana k6

Load testing for engineering teams

Prometheus

Prometheus

Monitor Kubernetes and cloud native

OpenTelemetry

OpenTelemetry

Instrument and collect telemetry data

Graphite

Graphite

Scalable monitoring for time series data

All

Community resources

Dashboard templates
Try out and share prebuilt visualizations
Prometheus exporters
Get your metrics into Prometheus quickly

end-to-end solutions

Opinionated solutions that help you get there easier and faster

Kubernetes Monitoring

Kubernetes Monitoring

Get K8s health, performance, and cost monitoring from cluster to container

Application Observability

Application Observability

Monitor application performance

Frontend Observability

Frontend Observability

Gain real user monitoring insights

Incident Response & Management

Incident Response & Management

Detect and respond to incidents with a simplified workflow

monitor infrastructure

Out-of-the-box KPIs, dashboards, and alerts for observability

linux server logo Linux
windows logo Windows
docker logo Docker
postgresql logo Postgres
mysql logo MySQL
aws logo AWS
kafka logo Kafka
jenkins logo Jenkins
rabbitmq logo RabbitMQ
mongodb logo MongoDB
microsoft azure observability logo Microsoft Azure
google cloud observability with grafana cloud logo Google Cloud

visualize any data

Instantly connect all your data sources to Grafana

mongodb logo MongoDB
appdynamics logo AppDynamics
oracle database logo Oracle
gitlab logo GitLab
jira logo Jira
salesforce logo Salesforce
splunk logo Splunk
datadog logo Datadog
new relic logo New Relic
snowflake logo Snowflake
All monitoring and visualization solutions

Community and events

Events

ObservabilityCON 2025 (7-9 Oct)

GrafanaCON 2025

ObservabilityCON on the Road

Community

Community forums

Resources

Blog

Observability survey report 2025

Benefits of Observability

Success stories

How-to

Documentation

Webinars and videos

Tutorials

Workshops

Learning Journeys

Professional Services

Featured webinar

Getting started with grafana LGTM stack

Getting started with managing your metrics, logs, and traces using Grafana

Learn how to unify, correlate, and visualize data with dashboards using Grafana.

Learn more →
Try using Grot AI Grot AI for this query ->
Blog
  • All
  • Community
  • Culture
  • Engineering
  • News
  • Release
Blog
  • All
  • Community
  • Culture
  • Engineering
  • News
  • Release
Tags

Engineering

View all tags
Zabbix plugin for Grafana: Grafana Labs will manage and maintain the popular plugin

Alexander Zobnin   ·   16 Jan 2024   ·   4 min read

Zabbix plugin for Grafana: Grafana Labs will manage and maintain the popular plugin

Grafana Labs is taking ownership of the Zabbix plugin for Grafana, one of the most popular third-party plugins for the data visualization tool.

Engineering

Read more


Working at Grafana Labs: Making the shift from individual contributor to engineering manager

Haris Rozajac   ·   5 Jan 2024   ·   9 min read

Working at Grafana Labs: Making the shift from individual contributor to engineering manager

Learn about how to become an engineering manager and get tips for being successful in the new role.

Engineering

Read more


A comparison of InfluxQL, SQL, and Flux query languages for Grafana dashboards

Grant Pinkos   ·   29 Dec 2023   ·   7 min read

A comparison of InfluxQL, SQL, and Flux query languages for Grafana dashboards

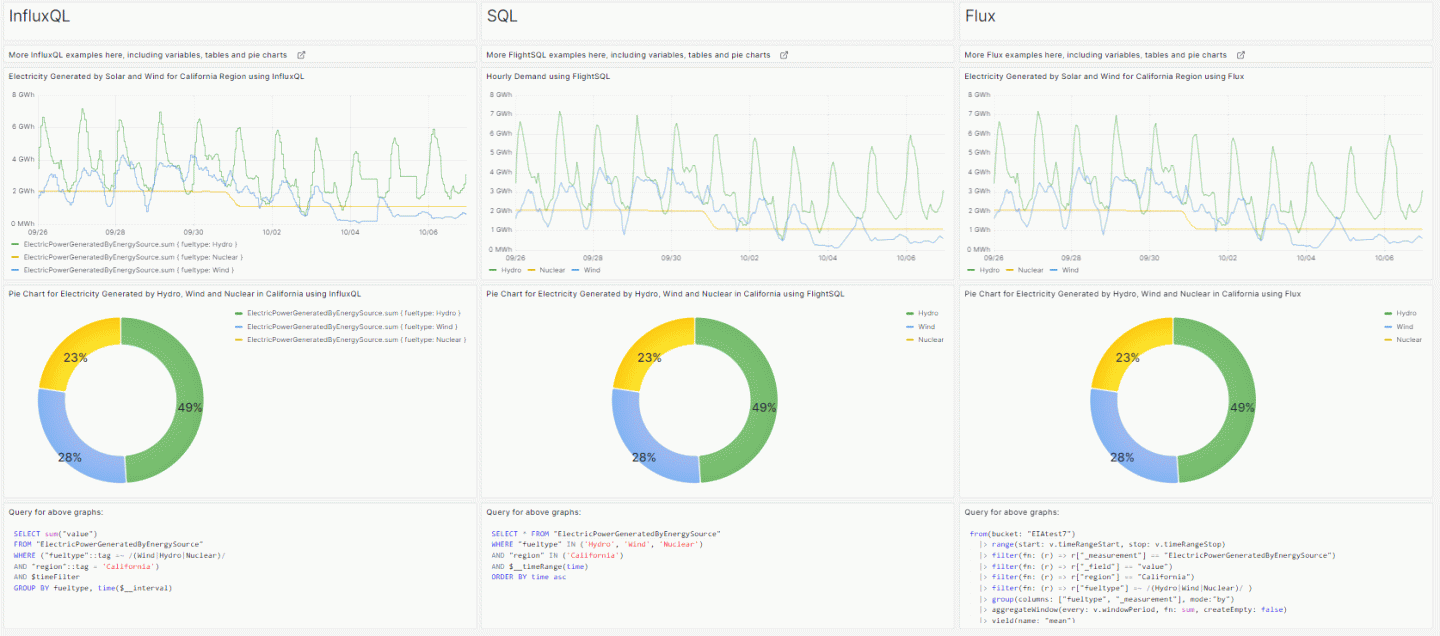
Before getting started with InfluxDB and Grafana — a powerful duo for data management and visualization — you need to choose between three query...

Community
Engineering
Influx

Read more


How to integrate Grafana Alerting and Telegram

Antonio Calero Merello   ·   28 Dec 2023   ·   4 min read

How to integrate Grafana Alerting and Telegram

From creating a contact point to configuring notification policies, learn how to integrate Grafana Alerting and Telegram to receive alerts on the...

Alerting
Engineering

Read more


Open source at Grafana Labs in 2023: Year in review

Kristin Knapp   ·   21 Dec 2023   ·   9 min read

Open source at Grafana Labs in 2023: Year in review

From major releases to new projects like Grafana Beyla and Grafana Pyroscope, 2023 was a big year for OSS projects, and the open source community,...

Community
Engineering
Company news

Read more


Grafana Labs in 2023: Top 10 moments of the year

Michelle Tan   ·   19 Dec 2023   ·   9 min read

Grafana Labs in 2023: Top 10 moments of the year

Grafana 10! Pyroscope! Beyla! It was a year of celebrating milestones, launching new projects, and honoring the community.

Engineering
Community
Company news

Read more


New in Grafana k6: The latest OSS features in v0.48.0 and user-defined project limits in Grafana Cloud k6

Wei Li   ·   14 Dec 2023   ·   7 min read

New in Grafana k6: The latest OSS features in v0.48.0 and user-defined project limits in Grafana...

Grafana k6 v0.48.0 is here, featuring a new module for file interactions, a new subcommand to generate test scripts, and more.

Engineering

Read more


Observability with Grafana Cloud: Explore the latest and greatest features

Grafana Labs Team   ·   1 Dec 2023   ·   4 min read

Observability with Grafana Cloud: Explore the latest and greatest features

Learn more about the latest Grafana Cloud updates and best practices in these on-demand videos from ObservabilityCON 2023.

Engineering
Events

Read more


Grafana Agent v0.38 release: new OpenTelemetry components, configuration improvements, and more

Paschalis Tsilias   ·   29 Nov 2023   ·   3 min read

Grafana Agent v0.38 release: new OpenTelemetry components, configuration improvements, and more

The latest Grafana Agent release includes new OpenTelemetry components, configuration improvements, enhanced log collection.

Engineering

Read more


How to calculate the difference of a value over time with InfluxDB and Grafana

Antonio Calero Merello   ·   28 Nov 2023   ·   4 min read

How to calculate the difference of a value over time with InfluxDB and Grafana

With this step-by-step post, learn how to use InfluxDB as a Grafana data source to monitor the difference of a value over time.

Engineering

Read more


Announcing Application Observability in Grafana Cloud, with native support for OpenTelemetry and Prometheus

Wei Li   ·   14 Nov 2023   ·   6 min read

Announcing Application Observability in Grafana Cloud, with native support for OpenTelemetry and...

Grafana Cloud Application Observability provides a curated solution that makes it easier to get started with monitoring application performance and...

Application Observability
Frontend observability
Engineering

Read more


Grafana panel titles: Why we changed from center to left-aligned

Alexa Vargas Ortega   ·   8 Nov 2023   ·   6 min read

Grafana panel titles: Why we changed from center to left-aligned

The redesigned panel headers we rolled out earlier this year help accommodate the wide range of Grafana use cases that have emerged over the years.

Engineering

Read more


How we upgraded to MySQL 8 in Grafana Cloud

Owen Smallwood   ·   6 Nov 2023   ·   8 min read

How we upgraded to MySQL 8 in Grafana Cloud

Learn how the Grafana Labs engineering team upgraded Grafana Cloud databases to MySQL 8 using an incremental, staged approach that resulted in little...

Engineering

Read more


Create a logs app plugin with Grafana Scenes and Grafana Loki

Matias Wenceslao Chomicki   ·   31 Oct 2023   ·   11 min read

Create a logs app plugin with Grafana Scenes and Grafana Loki

Learn how to harness the power of Grafana Scenes, Grafana Loki and Grafana plugin tools to create a dynamic application for querying and visualizing...

Engineering

Read more


The benefits of web performance testing with Grafana k6 browser and Grafana Faro

Marie Cruz   ·   25 Oct 2023   ·   8 min read

The benefits of web performance testing with Grafana k6 browser and Grafana Faro

While Grafana k6 browser can help measure the performance of frontend applications, it’s most powerful when complemented with real user monitoring...

Engineering
Frontend observability
Application Observability

Read more


  • ««
  • «
  • 1
  • 2
  • 3
  • 4
  • 5
  • »
  • »»
Sign up for Grafana stack updates
Note: By signing up, you agree to be emailed related product-level information.


Products
  • Grafana Cloud
  • Grafana Enterprise Stack
  • Grafana visualizations
  • Plugins
  • Grafana Cloud Logs
  • Grafana Cloud Metrics
  • Grafana Cloud Traces
  • Grafana Cloud Profiles
  • AI/ML tools for observability
  • Application Observability
  • Frontend Observability
  • Grafana Cloud Asserts
  • Grafana IRM
  • Grafana k6
  • Grafana SLO
  • Synthetic Monitoring
  • Solutions
  • Pricing
Open Source
  • Grafana
  • Grafana Alloy
  • Grafana Beyla
  • Grafana Faro
  • Grafana k6
  • Grafana Loki
  • Grafana Mimir
  • Grafana OnCall
  • Grafana Pyroscope
  • Grafana Tanka
  • Grafana Tempo
  • Graphite
  • OpenTelemetry
  • Prometheus
  • Dashboard templates
  • Downloads
  •   GitHub
Learn
  • Documentation
  • Grafana Labs blog
  • Webinars and videos
  • Tutorials
  • Workshops
  • Events
  • Community
  • Professional Services
  • Community forums
  • Community Slack
  • Grafana Champions
  • Community organizers
  • Observability Survey Report 2025
  • OSS vs Cloud
  • Writers' Toolkit
  • Plugin development
  • Load testing
  • OpenTelemetry Report
  • Log monitoring
Company
  • Partnerships
  • Our team
  • Careers
  • Success stories
  • Newsroom
  • Contact us
  • Getting help
  • Merch
  • Open positions We're hiring
  • The Story of Grafana
Compare
  • Grafana vs. Datadog
Localized content
  • Japanese pages
  • German pages
  • French pages
  • Spanish pages
  • Portuguese pages

  • Grafana Cloud status
  • Legal and Security
  • Terms of Service
  • Privacy Policy
  • Trademark Policy
Copyright 2025 © Grafana Labs
Grafana Labs uses cookies for the normal operation of this website. Learn more.