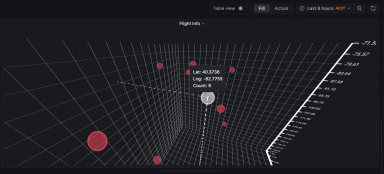
Introducing the XYZ chart: A three-dimensional way to visualize your data in Grafana
Read more
Products
LGTM+ Stack
Key Capabilities
Observability Solutions
Deploy The Stack
Open Source
Community resources
Dashboard templates
Try out and share prebuilt visualizations
Prometheus exporters
Get your metrics into Prometheus quickly
end-to-end solutions
Opinionated solutions that help you get there easier and faster
monitor infrastructure
Out-of-the-box KPIs, dashboards, and alerts for observability
visualize any data
Instantly connect all your data sources to Grafana
Learn
Stay up to date
Technical learning
Docs
Get started
Get started with Grafana
Build your first dashboard
Get started with Grafana Cloud
What's new / Release notes
Help build the future of open source observability software Open positions
Check out the open source projects we support Downloads
Deploy The Stack
end-to-end solutions
Opinionated solutions that help you get there easier and faster
visualize any data
Instantly connect all your data sources to Grafana
Victor Marin · 24 Feb 2023 · 4 min read
Read more
Ed Welch · 15 Feb 2023 · 6 min read
Read more
Andy Murray · 18 Jan 2023 · 6 min read
Read more
Joey Bartolomeo · 30 Dec 2022 · 10 min read
Read more
Liang Wu · 4 Oct 2022 · 6 min read
Learn how this biotech startup uses moss to filter air pollutants, and how it relies on Grafana to optimize those efforts.
Read more
Serena Kappes · 22 Sep 2022 · 4 min read
Find out how the pandemic spurred a Wix developer to try his hand at hardware hacking using a mini-arcade and a Raspberry Pi to display Grafana...
Read more
Esteban Beltran · 14 Sep 2022 · 2 min read
Read more
Owen Smallwood · 17 Aug 2022 · 3 min read
Read more
Joey Bartolomeo · 17 Jun 2022 · 7 min read
Read more
Alexandre de Verteuil · 6 Jun 2022 · 15 min read
Creating dashboard chaos is easy. Knowing what types of Grafana dashboards your team will need helps to create a structure for organizing and finding...
Read more
Mike Johnson · 29 Mar 2022 · 3 min read
In this tutorial video, we show you how to set up the New Relic data source plugin for Grafana and some of its most popular features.
Read more
Mary Sitzenstatter · 28 Feb 2022 · 7 min read
Grafana's cardinality dashboards gives users the ability to analyze cardinality data from a broad to a more targeted view.
Read more
Alexandre de Verteuil · 3 Feb 2022 · 5 min read
Read more
Lauren Johnson · 10 Jan 2022 · 4 min read
How one technology company built an effective end-to-end observability solution within weeks with Grafana Cloud.
Read more
Simon Legander · 5 Jan 2022 · 5 min read
Bring together your QA, infrastructure, and application metrics during performance testing with the k6 Cloud app plugin for Grafana.
Read more
Register today! Explore sessions covering OpenTelemetry, Prometheus, & Loki, discover Grafana 12's latest features, and more.
RegisterAfter last year's record sellout, our biggest community event is headed to Seattle on May 6-8! Discover what's new in Grafana 12, learn from 20+ talks covering Prometheus, OpenTelemetry, & Loki, and much more.
No credit card needed, ever.
Become a Champion
Helping others embodies the spirit of open source, and we want to celebrate your invaluable contributions.
Become a ChampionGolden Grots
Helping others embodies the spirit of open source, and we want to celebrate your invaluable contributions.
Submit your dashboardBecome a Contributor
Helping others embodies the spirit of open source, and we want to celebrate your invaluable contributions.
Gain insight into unused metrics and optimize metric cardinality with the new cardinality management dashboards and Adaptive Metrics