Grafana variables: what they are and how they create dynamic dashboards
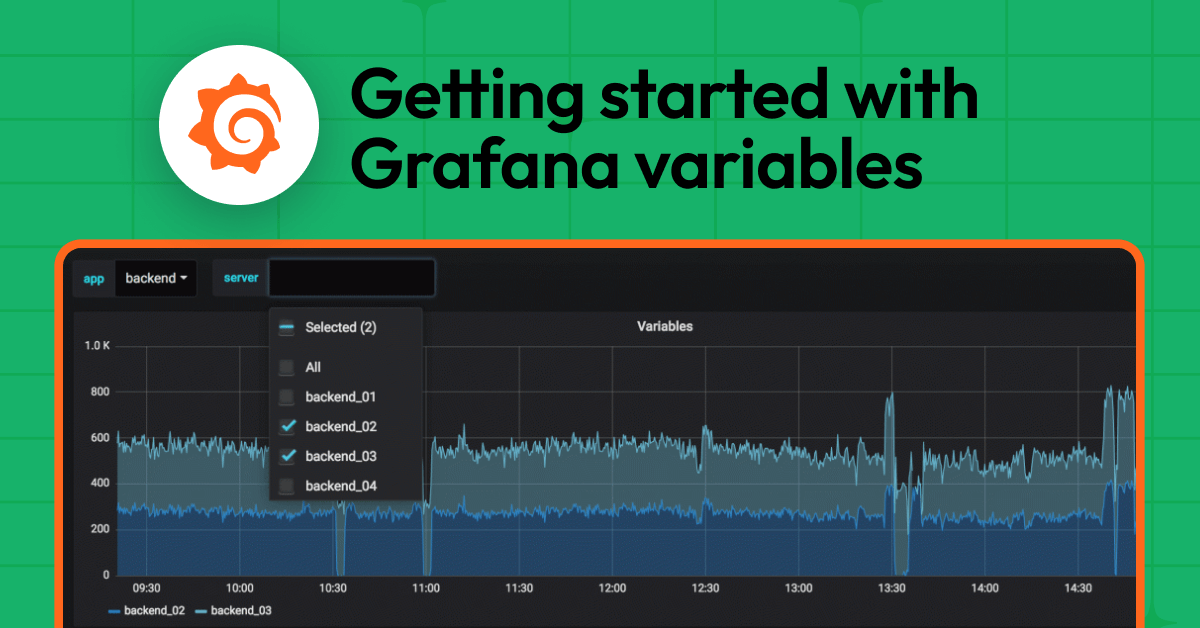
Variables in Grafana allow you to filter and search for the data you care about most, without having to edit queries or rebuild dashboards.
Read more
Products
Grafana Cloud
Monitor, analyze, and act faster with AI-powered observability.
LGTM+ Stack
Key Capabilities
Observability Solutions
end-to-end solutions
Opinionated solutions that help you get there easier and faster
monitor infrastructure
Out-of-the-box KPIs, dashboards, and alerts for observability
visualize any data
Instantly connect all your data sources to Grafana
Grafana Cloud
Monitor, analyze, and act faster with AI-powered observability.
The actually useful free plan
10k series Prometheus metrics
50GB logs, 50GB traces, 50GB profiles
500VUk k6 testing
20+ Enterprise data source plugins
100+ pre-built solutions
Opinionated solutions that help you get there easier and faster
Instantly connect all your data sources to Grafana
Getting started with managing your metrics, logs, and traces using Grafana
Learn how to unify, correlate, and visualize data with dashboards using Grafana.
Variables in Grafana allow you to filter and search for the data you care about most, without having to edit queries or rebuild dashboards.
Read more
Simplify the management of Grafana dashboards in Git by managing them as code, outside of Grafana.
Read more
How Japan's space agency used Grafana to monitor its first moon landing in real time
Read more
Building your first Grafana dashboard? Here are some essential guidelines to craft something that’s both eye-catching and impactful for you and your...
Read more
Ruben Fernandez is one of the winners of the 2024 Golden Grot Awards! Find out how his Grafana dashboard plays a central role in his morning commute.
Read more
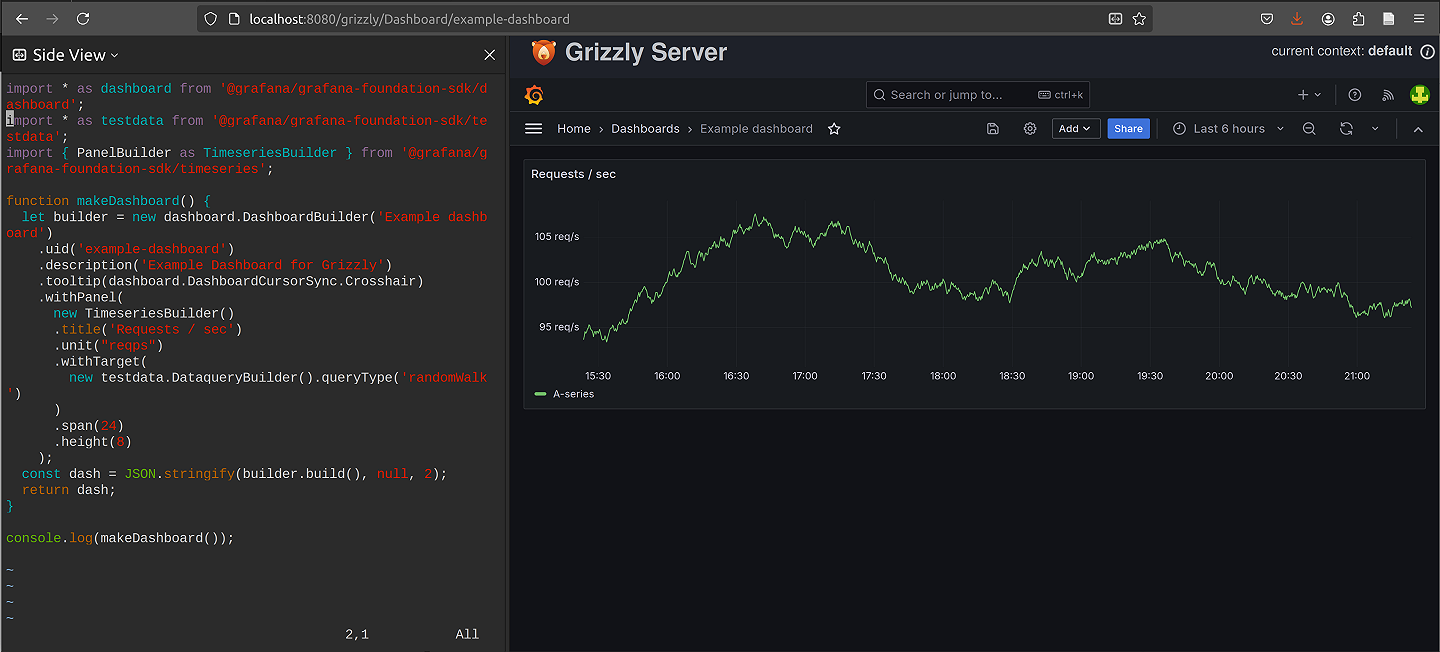
In this step-by-step blog post, learn how to get CSV data from any Grafana visualization into popular spreadsheet applications like Microsoft Excel or...
Read more
Christopher Field is one of the winners of the 2024 Golden Grot Awards. Find out why his win is a testament to all the non-traditional use cases for...
Read more
A security report claiming there’s a SQL injection attack in Grafana is incorrect. It is the intended and documented behavior for authenticated users...
Read more
Learn how to set up a Grafana dashboard so you don't miss updates from the YouTubers you love.
Read more
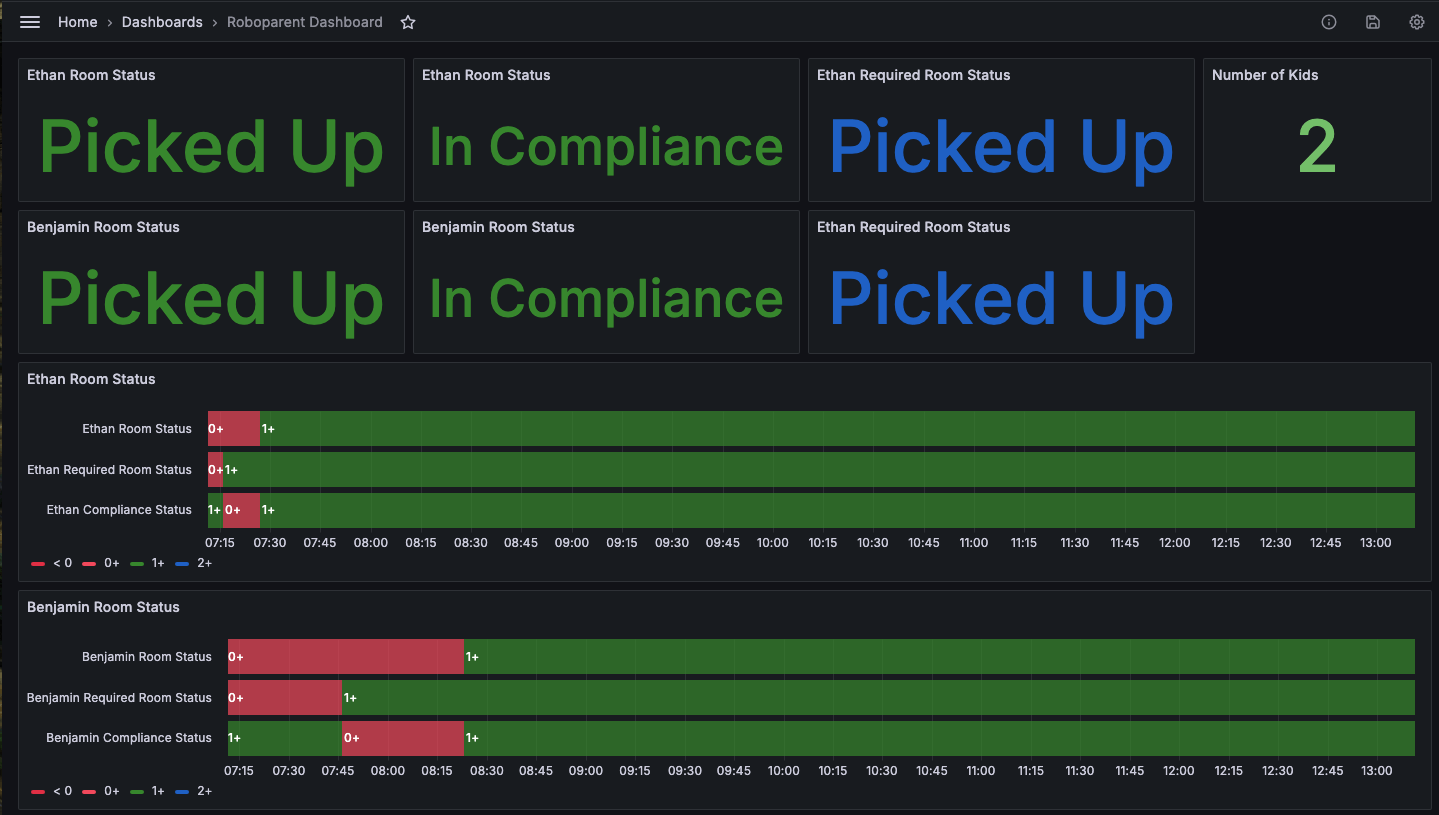
Motivating kids to clean their rooms — and keeping tabs on their progress — can be a challenge. Here’s how to make things a little easier with Grafana...
Read more
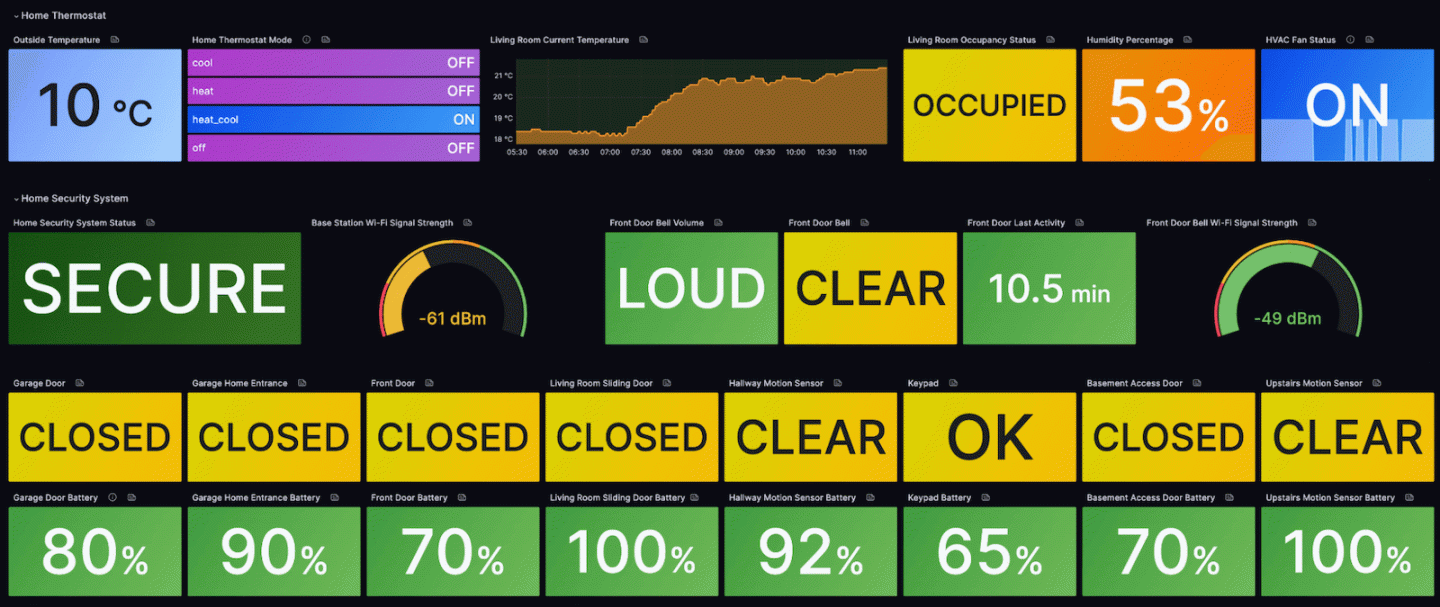
Find out how to use Grafana Cloud to visualize and monitor your home with smart devices.
Read more
How Grafana community members are using their dashboards for projects at work and at home
Read more
Grafana Labs' acquisition of Asserts.ai will bring to Grafana Cloud the ability to more easily explore your telemetry and derive new insights for more...
Read more
Learn how to quickly and easily find the current value of a metric from a range in a Grafana dashboard.
Read more
They span across land, sea, space, and virtual worlds. Check out some of the most memorable Grafana dashboards from the past decade.
Read more