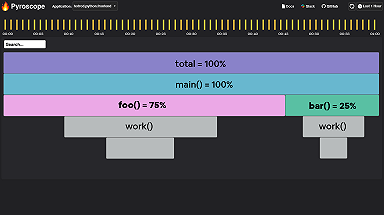
Ad hoc profiling mode with Pyroscope
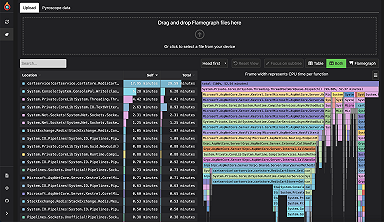
Learn how Pyroscope continuous profiling gives you the opportunity to jump around to any point in time. This fluid profiling is beneficial for...
Read more
Products
LGTM+ Stack
Key Capabilities
Observability Solutions
Deploy The Stack
Open Source
Community resources
Dashboard templates
Try out and share prebuilt visualizations
Prometheus exporters
Get your metrics into Prometheus quickly
end-to-end solutions
Opinionated solutions that help you get there easier and faster
monitor infrastructure
Out-of-the-box KPIs, dashboards, and alerts for observability
visualize any data
Instantly connect all your data sources to Grafana
Learn
Stay up to date
Technical learning
Docs
Get started
Get started with Grafana
Build your first dashboard
Get started with Grafana Cloud
What's new / Release notes
Help build the future of open source observability software Open positions
Check out the open source projects we support Downloads
Deploy The Stack
end-to-end solutions
Opinionated solutions that help you get there easier and faster
visualize any data
Instantly connect all your data sources to Grafana
Ryan Perry · 22 Jan 2022 · 3 min read
Learn how Pyroscope continuous profiling gives you the opportunity to jump around to any point in time. This fluid profiling is beneficial for...
Read more
Ryan Perry · 22 Jan 2022 · 4 min read
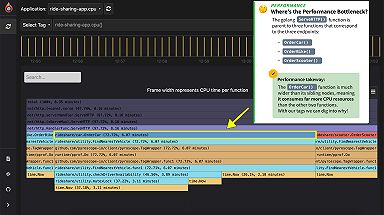
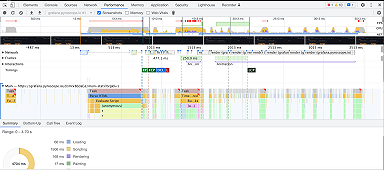
Explore a simplified, basic use case of Pyroscope where we simulate a "ride share" company which has three endpoints.
Read more
Grafana Labs Team · 14 Oct 2021 · 5 min read
Profiling in Python with the Pyroscope Pip Package | Grafana
Read more
Grafana Labs Team · 4 Oct 2021 · 5 min read
Learn how to perform continuous profiling in Ruby with the Grafana Pyroscope RubyGem feature.
Read more
Grafana Labs Team · 26 Jan 2021 · 4 min read
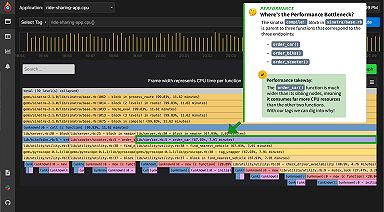
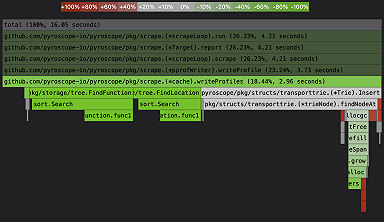
Debugging performance issues on Python servers can be incredibly frustrating, but did you know you can use flame graphs to get to the root of the...
Read more
Register today! Explore sessions covering OpenTelemetry, Prometheus, & Loki, discover Grafana 12's latest features, and more.
RegisterAfter last year's record sellout, our biggest community event is headed to Seattle on May 6-8! Discover what's new in Grafana 12, learn from 20+ talks covering Prometheus, OpenTelemetry, & Loki, and much more.
No credit card needed, ever.
Become a Champion
Helping others embodies the spirit of open source, and we want to celebrate your invaluable contributions.
Become a ChampionGolden Grots
Helping others embodies the spirit of open source, and we want to celebrate your invaluable contributions.
Submit your dashboardBecome a Contributor
Helping others embodies the spirit of open source, and we want to celebrate your invaluable contributions.
Gain insight into unused metrics and optimize metric cardinality with the new cardinality management dashboards and Adaptive Metrics