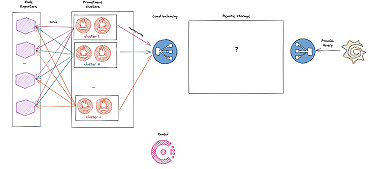
5 reasons why OVHcloud migrated its time series data to Grafana Mimir
Read more
Read more
Read more
Read more
Read more
Read more
Read more
Read more
Read more
Read more
Learn about the new Writers' Toolkit, designed to empower everyone to contribute to documentation at Grafana Labs, regardless of their function or...
Read more
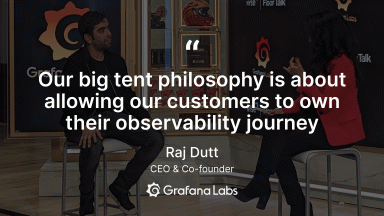
Grafana Labs CEO and Co-founder Raj Dutt sat down with NYSE Floor Talk to discuss the demand for better observability and the company's big tent...
Read more
Take a look back at GrafanaLive, a series of in-person events held in 18 cities across the globe to bring together the open source community.
Read more
With 175 million members relying on its website, health services provider Optum depends on Grafana Enterprise to help maintain a smooth website...
Read more
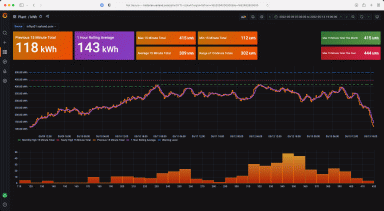
Learn how Varland Plating uses Grafana to visualize data collected from its industrial facility to improve the operations and make better business...
Read more
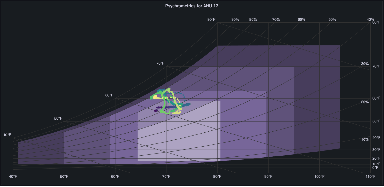
Find out how NERSC monitors HPC system health with Grafana and psychrometric charts to diagnose problems and optimize energy consumption.
Read more

