• Products Open Source Solutions Learn Docs Pricing
  • Downloads Contact us Sign in
Create free account Contact us

Products

Grafana Cloud

Monitor, analyze, and act faster with AI-powered observability.

Grafana Cloud
Grafana Cloud overview

LGTM+ Stack

Grafana Cloud Logs

Logs

powered by Grafana Loki

Grafana

Grafana

for visualization

Grafana Cloud Traces

Traces

powered by Grafana Tempo

Grafana Cloud Metrics

Metrics

powered by Grafana Mimir and Prometheus

Key Capabilities

AI/ML

AI/ML insights

Identify anomalies and reduce toil

Grafana Cloud Asserts

Contextual root cause analysis

Automated anomaly correlation

Grafana SLO

SLO management

Create SLOs and error budget alerts

Grafana Alerting

Alerting

Trigger alerts from any data source

Plugins

Plugins

Connect Grafana to data sources, apps, and more

Observability Solutions

Application Observability

Application Observability

Monitor application performance

Infrastructure Observability

Infrastructure observability

Ensure infrastructure health and performance

Testing

Grafana Cloud k6

Performance testing

Powered by Grafana k6

Synthetic Monitoring

Synthetic Monitoring

powered by Grafana k6

IRM

Incident

Incident response

Routine task automation for incidents

OnCall

On-call management

Flexible on-call management

Open Source

Grafana Loki

Multi-tenant log aggregation system

Grafana

Query, visualize, and alert on data

Grafana Tempo

High-scale distributed tracing backend

Grafana Mimir

Scalable and performant metrics backend

Grafana Pyroscope

Scalable continuous profiling backend

Grafana Beyla

eBPF auto-instrumentation

Grafana Faro

Frontend application observability web SDK

Grafana Alloy

OpenTelemetry Collector distribution with Prometheus pipelines

Grafana k6

Load testing for engineering teams

Prometheus

Monitor Kubernetes and cloud native

OpenTelemetry

Instrument and collect telemetry data

Graphite

Scalable monitoring for time series data

All

Community resources

Dashboard templates

Try out and share prebuilt visualizations

Prometheus exporters

Get your metrics into Prometheus quickly

end-to-end solutions

Opinionated solutions that help you get there easier and faster

Kubernetes Monitoring

Get K8s health, performance, and cost monitoring from cluster to container

Application Observability

Monitor application performance

Frontend Observability

Gain real user monitoring insights

Incident Response & Management

Detect and respond to incidents with a simplified workflow

All monitoring and visualization solutions

monitor infrastructure

Out-of-the-box KPIs, dashboards, and alerts for observability

linux server logo
Linux
windows logo
Windows
docker logo
Docker
postgresql logo
Postgres
mysql logo
MySQL
aws logo
AWS
kafka logo
Kafka
jenkins logo
Jenkins
rabbitmq logo
RabbitMQ
mongodb logo
MongoDB
microsoft azure observability logo
Microsoft Azure
google cloud observability with grafana cloud logo
Google Cloud
All monitoring solutions

visualize any data

Instantly connect all your data sources to Grafana

mongodb logo
MongoDB
appdynamics logo
AppDynamics
oracle database logo
Oracle
gitlab logo
GitLab
jira logo
Jira
salesforce logo
Salesforce
splunk logo
Splunk
datadog logo
Datadog
new relic logo
New Relic
snowflake logo
Snowflake
All visualization solutions

Learn

Community and events

Events

Upcoming in-person and virtual events

ObservabilityCON 2025 (7-9 Oct)

Our flagship observability event

GrafanaCON 2025

Our annual OSS community conference

ObservabilityCON on the Road

Our observability conference on the road

Community

Join the Grafana community

Community forums

Ask the community for help

Resources

Blog

News, releases, cool stories, and more

4th annual Observability Survey

Share your thoughts on the state of observability

Benefits of Observability

New research, reports, and insights

Success stories

By use case, product, and industry

How-to

Documentation

All the docs

Webinars and videos

Demos, webinars, and feature tours

Tutorials

Step-by-step guides

Workshops

Free, in-person or online

Learning Journeys

Expert guidance for mastering our platform

Professional Services

Expert guidance and training

Docs
Pricing

Help build the future of open source observability software Open positions

Check out the open source projects we support Downloads

Sign in

Grafana Cloud

Monitor, analyze, and act faster with AI-powered observability.

Grafana Cloud
Grafana Cloud overview

LGTM+ Stack

Grafana Cloud Logs

Logs

Grafana

Grafana

Grafana Cloud Traces

Traces

Grafana Cloud Metrics

Metrics

Key Capabilities

AI/ML

AI/ML insights

Grafana Cloud Asserts

Contextual root cause analysis

Grafana SLO

SLO management

Grafana Alerting

Alerting

Plugins

Plugins

Observability Solutions

Application Observability

Application Observability

Infrastructure Observability

Infrastructure observability

Testing

Grafana Cloud k6

Performance testing

Synthetic Monitoring

Synthetic Monitoring

IRM

Incident

Incident response

OnCall

On-call management

The actually useful free plan

Grafana Cloud Free Tier
check

10k series Prometheus metrics

check

50GB logs, 50GB traces, 50GB profiles

check

500VUk k6 testing

check

20+ Enterprise data source plugins

check

100+ pre-built solutions

Create account
Grafana Cloud Logs

Grafana Loki

Multi-tenant log aggregation system

Grafana

Grafana

Query, visualize, and alert on data

Grafana Cloud Traces

Grafana Tempo

High-scale distributed tracing backend

Grafana Cloud Metrics

Grafana Mimir

Scalable and performant metrics backend

Grafana Cloud Profiles

Grafana Pyroscope

Scalable continuous profiling backend

Grafana Beyla

eBPF auto-instrumentation

Grafana Faro

Grafana Faro

Frontend application observability web SDK

Grafana Alloy

Grafana Alloy

OpenTelemetry Collector distribution with Prometheus pipelines

Grafana Cloud k6

Grafana k6

Load testing for engineering teams

Prometheus

Prometheus

Monitor Kubernetes and cloud native

OpenTelemetry

OpenTelemetry

Instrument and collect telemetry data

Graphite

Graphite

Scalable monitoring for time series data

All

Community resources

Dashboard templates
Try out and share prebuilt visualizations
Prometheus exporters
Get your metrics into Prometheus quickly

end-to-end solutions

Opinionated solutions that help you get there easier and faster

Kubernetes Monitoring

Kubernetes Monitoring

Get K8s health, performance, and cost monitoring from cluster to container

Application Observability

Application Observability

Monitor application performance

Frontend Observability

Frontend Observability

Gain real user monitoring insights

Incident Response & Management

Incident Response & Management

Detect and respond to incidents with a simplified workflow

monitor infrastructure

Out-of-the-box KPIs, dashboards, and alerts for observability

linux server logo Linux
windows logo Windows
docker logo Docker
postgresql logo Postgres
mysql logo MySQL
aws logo AWS
kafka logo Kafka
jenkins logo Jenkins
rabbitmq logo RabbitMQ
mongodb logo MongoDB
microsoft azure observability logo Microsoft Azure
google cloud observability with grafana cloud logo Google Cloud

visualize any data

Instantly connect all your data sources to Grafana

mongodb logo MongoDB
appdynamics logo AppDynamics
oracle database logo Oracle
gitlab logo GitLab
jira logo Jira
salesforce logo Salesforce
splunk logo Splunk
datadog logo Datadog
new relic logo New Relic
snowflake logo Snowflake
All monitoring and visualization solutions

Community and events

Events

ObservabilityCON 2025 (7-9 Oct)

GrafanaCON 2025

ObservabilityCON on the Road

Community

Community forums

Resources

Blog

4th annual Observability Survey

Benefits of Observability

Success stories

How-to

Documentation

Webinars and videos

Tutorials

Workshops

Learning Journeys

Professional Services

Featured webinar

Getting started with grafana LGTM stack

Getting started with managing your metrics, logs, and traces using Grafana

Learn how to unify, correlate, and visualize data with dashboards using Grafana.

Learn more →
Try using Grot AI Grot AI for this query ->
Blog
  • All
  • Community
  • Culture
  • Engineering
  • News
  • Release
Blog
  • All
  • Community
  • Culture
  • Engineering
  • News
  • Release
Tags

Community

View all tags
Open source at Grafana Labs in 2023: Year in review

Kristin Knapp   ·   21 Dec 2023   ·   9 min read

Open source at Grafana Labs in 2023: Year in review

From major releases to new projects like Grafana Beyla and Grafana Pyroscope, 2023 was a big year for OSS projects, and the open source community,...

Community
Engineering
Company news

Read more


Grafana Labs in 2023: Top 10 moments of the year

Michelle Tan   ·   19 Dec 2023   ·   9 min read

Grafana Labs in 2023: Top 10 moments of the year

Grafana 10! Pyroscope! Beyla! It was a year of celebrating milestones, launching new projects, and honoring the community.

Engineering
Community
Company news

Read more


'The Story of Grafana' documentary: The community behind the code

Michelle Tan   ·   12 Dec 2023   ·   3 min read

'The Story of Grafana' documentary: The community behind the code

Explore the power of Grafana's open source community and hear from early contributors who did everything from fixing spelling errors to building...

Company news
Community

Read more


Get an early look at the 2024 Grafana Labs Observability Survey, and weigh in before it's too late

Grafana Labs Team   ·   30 Nov 2023   ·   5 min read

Get an early look at the 2024 Grafana Labs Observability Survey, and weigh in before it's too late

There's still time to take our annual observability survey. Share your thoughts, and check out what the community has to say so far.

Community
Observability

Read more


Saga Design System: shaping the future of user experiences at Grafana Labs

Staton Hysell   ·   7 Nov 2023   ·   4 min read

Saga Design System: shaping the future of user experiences at Grafana Labs

Through a well-organized set of design elements, patterns, and guidelines, Saga establishes a shared visual language for all of Grafana Labs’...

Design
Community
Open source

Read more


The Grafana developer portal: your gateway to enhanced plugin development

Joe Perez   ·   26 Oct 2023   ·   5 min read

The Grafana developer portal: your gateway to enhanced plugin development

The all-new Grafana developer portal is a central hub of curated resources for developers who want to extend Grafana's capabilities.

Grafana
Plugins
DevOps
Community

Read more


How Flexcity used Grafana Cloud to help balance the national power grid in France

Gina Lopez   ·   20 Oct 2023   ·   5 min read

How Flexcity used Grafana Cloud to help balance the national power grid in France

When winter is coming, Flexcity isn't worried because they have Grafana Cloud to visualize and monitor real-time energy consumption.

Community

Read more


An inside look at the Grafana open source community and what’s next

David Allen   ·   13 Oct 2023   ·   7 min read

An inside look at the Grafana open source community and what’s next

The contributions we’ve seen from the Grafana open source community over the years have been both impressive and inspiring — and we know we’re just...

Community

Read more


Ask Grot: How we're building a chatbot that's actually helpful on our website

Trevor Jones   ·   12 Oct 2023   ·   9 min read

Ask Grot: How we're building a chatbot that's actually helpful on our website

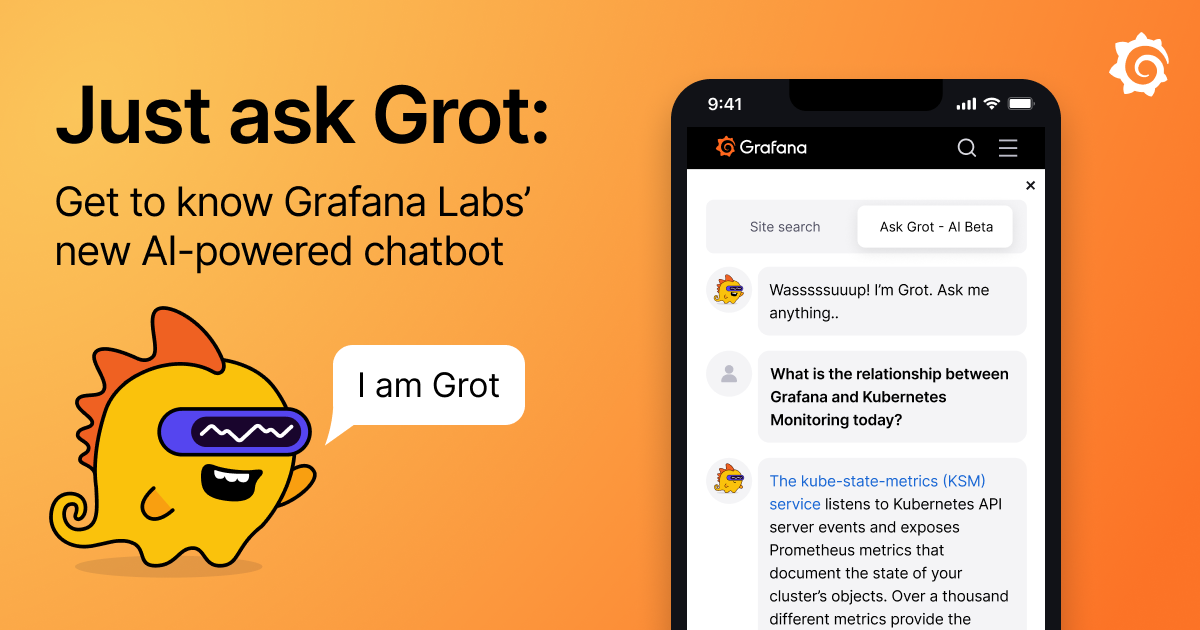
Looking for info about Grafana? Ask Grot! Our new AI-powered chatbot has been trained on Grafana Labs' projects and products (and we are always adding...

Community

Read more


Join Grafana Labs for the 10th Hacktoberfest!

Yaëlle Chaudy   ·   6 Oct 2023   ·   4 min read

Join Grafana Labs for the 10th Hacktoberfest!

Join the open source extravaganza! Connect with the global open source community, improve your skills, and make a lasting impact on projects you're...

Community

Read more


Reducing data center carbon emissions with Hardware Sentry, Grafana, and OpenTelemetry

Lauren Johnson   ·   2 Oct 2023   ·   4 min read

Reducing data center carbon emissions with Hardware Sentry, Grafana, and OpenTelemetry

Sentry Software ditched its legacy electricity monitoring solutions and safely reduced data center energy usage by 19% with Hardware Sentry, Grafana,...

Observability
OpenTelemetry
Open source
Community
Grafana

Read more


Introducing the Prometheus Java client 1.0.0

Fabian Stäber   ·   27 Sep 2023   ·   9 min read

Introducing the Prometheus Java client 1.0.0

The Prometheus Java client 1.0.0 is here! Tune in to PromCon on Friday, Sept. 29 to find out how we added a blazing fast implementation of Prometheus...

Community
Prometheus

Read more


Celebrating Grafana 10: Top 10 'Oh my Grafana!' dashboard moments of the decade

Grafana Labs Team   ·   26 Sep 2023   ·   5 min read

Celebrating Grafana 10: Top 10 'Oh my Grafana!' dashboard moments of the decade

They span across land, sea, space, and virtual worlds. Check out some of the most memorable Grafana dashboards from the past decade.

Dashboard
Grafana
Community

Read more


How to monitor SLOs with Grafana, Grafana Loki, Prometheus, and Pyrra: Inside the Daimler Truck observability stack

Lauren Johnson   ·   25 Sep 2023   ·   4 min read

How to monitor SLOs with Grafana, Grafana Loki, Prometheus, and Pyrra: Inside the Daimler Truck...

How Daimler Truck uses Grafana, Loki, Prometheus, and Pyrra to maximize uptime and minimize latency for their connected vehicle service.

GrafanaCon
Community
Loki
Prometheus

Read more


How universities preserve and protect digital assets with Grafana dashboards

Anthony Leroy   ·   22 Sep 2023   ·   8 min read

How universities preserve and protect digital assets with Grafana dashboards

Grafana has been a game-changer for a group of universities looking for a secure and customizable solution for monitoring digital archives.

Loki
Prometheus
Grafana
Community
Dashboard

Read more


  • ««
  • «
  • 2
  • 3
  • 4
  • 5
  • 6
  • »
  • »»
Sign up for Grafana stack updates
Note: By signing up, you agree to be emailed related product-level information.


Products
  • Grafana Cloud
  • Grafana Enterprise Stack
  • Grafana visualizations
  • Plugins
  • Grafana Cloud Logs
  • Grafana Cloud Metrics
  • Grafana Cloud Traces
  • Grafana Cloud Profiles
  • AI/ML tools for observability
  • Application Observability
  • Frontend Observability
  • Grafana Cloud Asserts
  • Grafana IRM
  • Grafana k6
  • Grafana SLO
  • Synthetic Monitoring
  • Solutions
  • Pricing
Open Source
  • Grafana
  • Grafana Alloy
  • Grafana Beyla
  • Grafana Faro
  • Grafana k6
  • Grafana Loki
  • Grafana Mimir
  • Grafana OnCall
  • Grafana Pyroscope
  • Grafana Tanka
  • Grafana Tempo
  • Graphite
  • OpenTelemetry
  • Prometheus
  • Dashboard templates
  • Downloads
  •   GitHub
Learn
  • Documentation
  • Grafana Labs blog
  • Webinars and videos
  • Tutorials
  • Workshops
  • Events
  • Community
  • Professional Services
  • Community forums
  • Community Slack
  • Grafana Champions
  • Community organizers
  • Observability Survey Report 2025
  • OSS vs Cloud
  • Writers' Toolkit
  • Plugin development
  • Load testing
  • OpenTelemetry Report
  • Log monitoring
Company
  • Partnerships
  • Our team
  • Careers
  • Success stories
  • Newsroom
  • Contact us
  • Getting help
  • Merch
  • Open positions We're hiring
  • The Story of Grafana
Compare
  • Grafana vs. Datadog
Localized content
  • Japanese pages
  • German pages
  • French pages
  • Spanish pages
  • Portuguese pages

  • Grafana Cloud status
  • Legal and Security
  • Terms of Service
  • Privacy Policy
  • Trademark Policy
Copyright 2025 © Grafana Labs
Grafana Labs uses cookies for the normal operation of this website. Learn more.