The benefits of web performance testing with Grafana k6 browser and Grafana Faro
While Grafana k6 browser can help measure the performance of frontend applications, it’s most powerful when complemented with real user monitoring...
Read more
Products
Grafana Cloud
Monitor, analyze, and act faster with AI-powered observability.
LGTM+ Stack
Key Capabilities
Observability Solutions
Open Source
Community resources
Dashboard templates
Try out and share prebuilt visualizations
Prometheus exporters
Get your metrics into Prometheus quickly
end-to-end solutions
Opinionated solutions that help you get there easier and faster
monitor infrastructure
Out-of-the-box KPIs, dashboards, and alerts for observability
visualize any data
Instantly connect all your data sources to Grafana
Learn
Community and events
Resources
Help build the future of open source observability software Open positions
Check out the open source projects we support Downloads
Grafana Cloud
Monitor, analyze, and act faster with AI-powered observability.
Observability Solutions
The actually useful free plan
10k series Prometheus metrics
50GB logs, 50GB traces, 50GB profiles
500VUk k6 testing
20+ Enterprise data source plugins
100+ pre-built solutions
end-to-end solutions
Opinionated solutions that help you get there easier and faster
visualize any data
Instantly connect all your data sources to Grafana
Marie Cruz · 25 Oct 2023 · 8 min read
While Grafana k6 browser can help measure the performance of frontend applications, it’s most powerful when complemented with real user monitoring...
Read more
Mario Macías Lloret · 13 Sep 2023 · 12 min read
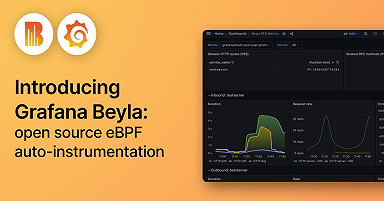
Report span information for basic transactions as well as RED metrics for your Linux HTTP/S and gRPC services — all without requiring any code...
Read more
