How Ultimate improved workflow, adoption, and more with Grafana IRM
Learn why Ultimate, which operates an AI-driven customer support automation platform, moved to Grafana Cloud for IRM and how those efforts were...
Read more
Learn why Ultimate, which operates an AI-driven customer support automation platform, moved to Grafana Cloud for IRM and how those efforts were...
Read more
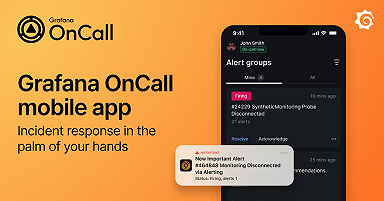
With the new OnCall mobile app, you can receive and manage alerts, configure notification policies, check your schedule, and more — all from your...
Read more
Read more
Read more
Read more
Read more
Read more
Torqata uses Grafana Alerting to quickly onboard tire retailers so they can share data and make better business decisions.
Read more
KCB Bank Uganda uses Grafana to track the status of its services and systems at a granular level, which helps to improve service uptime for its...
Read more
Find out how the pandemic spurred a Wix developer to try his hand at hardware hacking using a mini-arcade and a Raspberry Pi to display Grafana...
Read more
Read more
Read more
Read more
Grafana Alerting is now the default alerting system in Grafana, and we are introducing significant improvements based on your feedback, as well as...
Read more
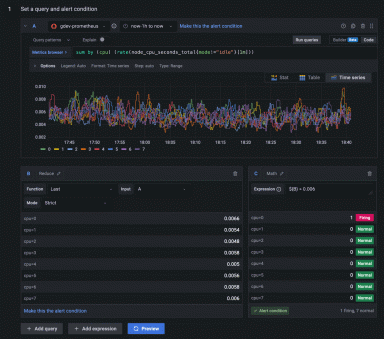
In Grafana Enterprise Metrics 2.0, you can create a single rule group that uses data from multiple tenants with the new cross-tenant alerting and...
Read more
