
With multiplying microservices running on Kubernetes, PayIt turned to Grafana and Prometheus for observability at cloud native scale
The multiplication problem
PayIt, which uses a microservices-based architecture, was a very early adopter of Kubernetes, running it for container orchestration since 2015.
At the beginning of the startup stage — before they began using Grafana — PayIt had one Kubernetes cluster, which made it easy for the infrastructure team to monitor everything manually.
Things were similarly uncomplicated for the application developers. Back when the app was getting five transactions on a good day, there was minimal clutter in the logs, making service logs and files easy to find.
But as PayIt’s business scaled and the company rolled out more services, the usual way of doing things became less effective. As one hundred services in one cluster became one hundred services in two clusters, simple queries became a thing of the past. “We had a multiplication problem,” explains Matt Beers, an engineer on PayIt’s infrastructure platform engineering team. As a result, the PayIt team had no easy way of knowing if a service downstream might be impacting a different service upstream — or how to query things to find out.
With more services, solving user-facing issues was also becoming more challenging, especially since the data traffic varies during the day. At that point, a scratch-built system to monitor alerts were set up to post to Slack, which often ended up being more confusing than helpful. The Slack alerts only signaled there were files in an unhealthy state, but not if that error had been corrected as there was no “green” alert after it returned to a healthy state. “We’d get an alert for two files, and then see a later alert for just one, and we’d have to infer from that that the second file had gone back to ‘healthy,’” Matt Menzenski, a software engineering manager for PayIt’s maintenance team says. “With the Grafana dashboards, we don’t have to infer anything, it’s all laid out explicitly.”
The big question: How could they turn the noise into a signal and get observability to see what was actually going on in their complex system?
A wealth of benefits
Cloud native from the beginning, PayIt was always on the lookout for cloud native solutions. With that in mind, the team looked for a tool that would provide some visibility at the infrastructure level, and because PayIt was a startup, would also be cost-friendly. They wanted a solution that also allowed their developers to do more self-servicing when it came to diagnosing issues, and it had to be something configurable that they could easily deploy into their existing infrastructure.
Their solution: Grafana and Prometheus.
One key reason they liked the combination: “It’s a big community-supported Kubernetes model,” Beers explains.
When we’re building cloud native, the expectation is that servers are immutable, and if they’re in a bad state, they go away and are replaced. Something like Grafana and Kubernetes that are already cloud native solves that problem out of the box.
Matt Beers, Engineer, Infrastructure Platform Engineering Team, Payit
And that means being able to support cloud native scale. As of early 2021, the company’s footprint has expanded to the point where there are now 9 Kubernetes clusters (with between 6 and 21 nodes each), and each cluster has its own Prometheus-Grafana cluster. They produce about 45 million logs a day, which translates into about 40 to 50GB a day of ingestion on the way out.
Tapping into the community dashboard ecosystem
PayIt currently has 36 Grafana dashboards consisting of hundreds of panels. About half of them are Kubernetes-based (cluster monitoring, pod monitoring, workflow, workload, control plane monitoring). Others cover Java services, node services, and metrics. The team got off to a quick start using Grafana by leveraging the existing community dashboards. “They already provide all the data and pull together all the metrics from the API servers and everything that we already need," Beers says.
For example, using a community template, Menzenski found it “really easy” to create a dashboard to expose Prometheus metric endpoints using the Node Prometheus client library. It only took about half an hour to get it running, and once the data was available, he was able to get immediate feedback from the team that would be using it. The response: “This is awesome. It’s just what we needed to be able to run this service in production.”
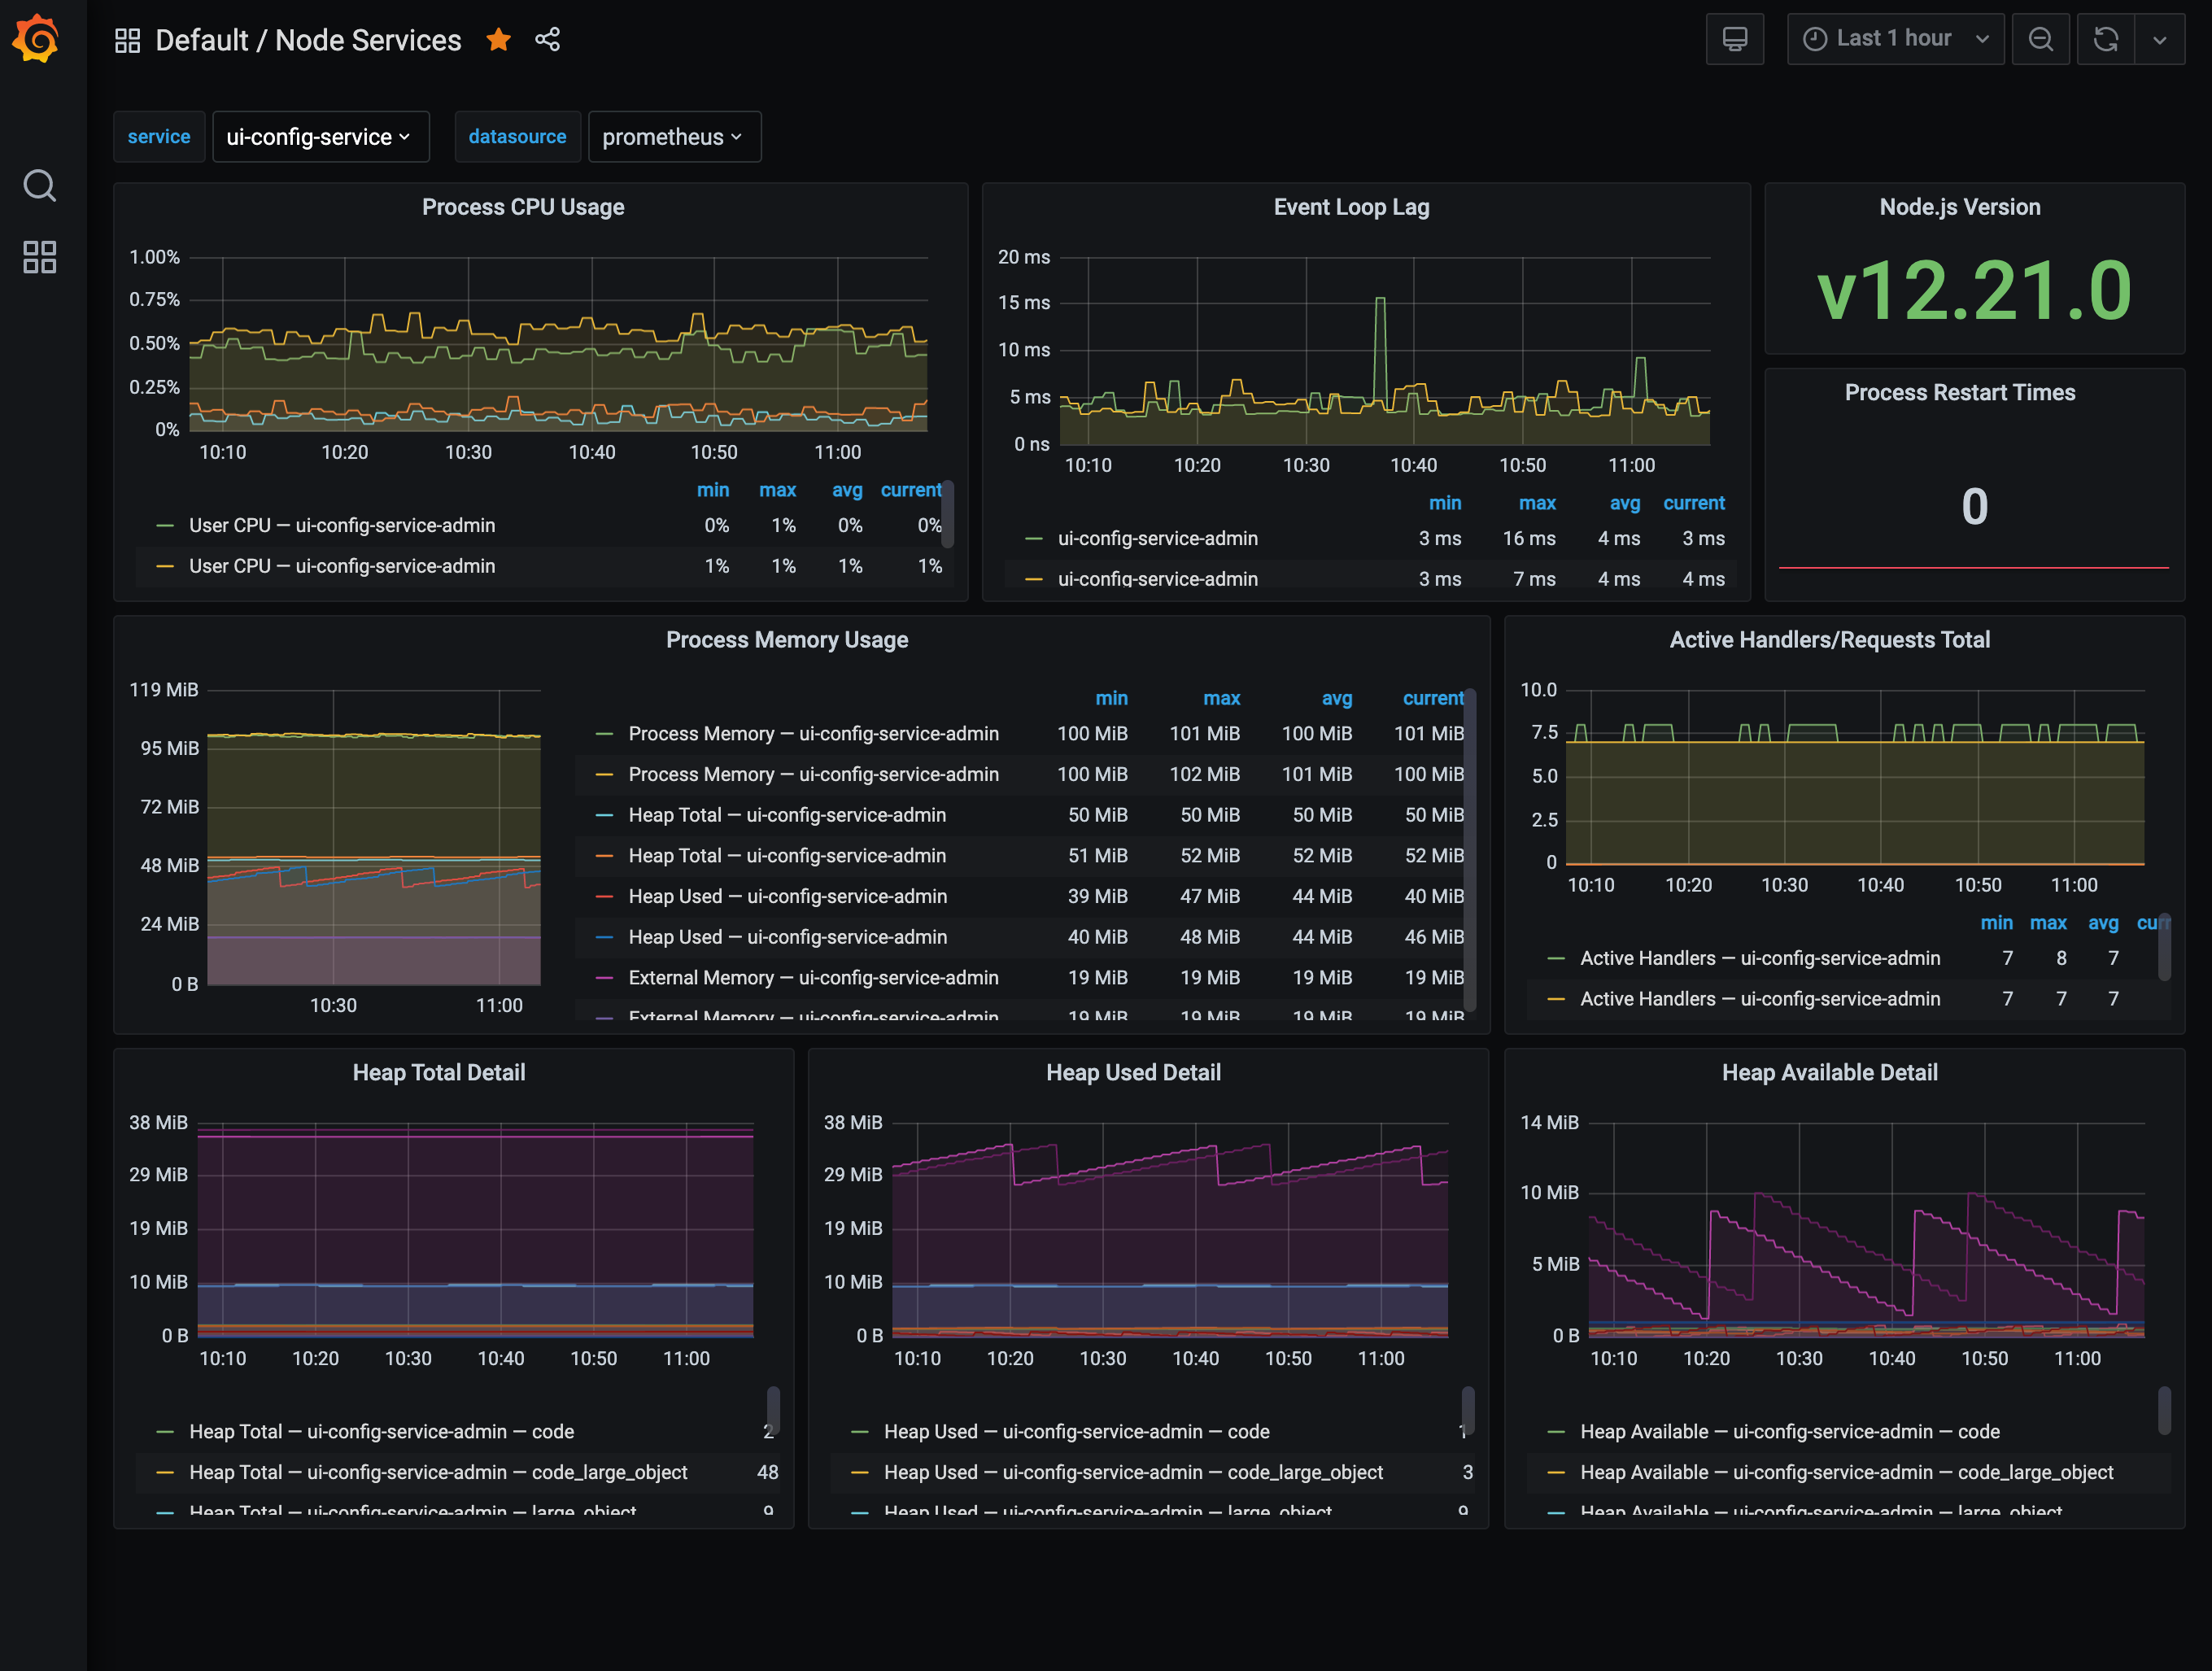
Menzenski truly appreciated how fast it came together, noting that as a non-Node.js developer, he would have spent the better part of a day to build it himself. Because creating a Grafana dashboard doesn’t require special expertise, in the dev environment, anyone at PayIt can log in as an administrator and make a dashboard with JSON.
As a result, PayIt has been able to build out some custom dashboards tailored to the specific needs of the business. One of its key dashboards helps with alerting on daily data file deliveries (such as daily reports on municipal bill balances) from clients. “If that file doesn’t arrive, it’s bad news,” Menzenski says. “It means our balances might be out of date or a payment isn’t going to be reflected in the client system and that means a bad citizen experience.”
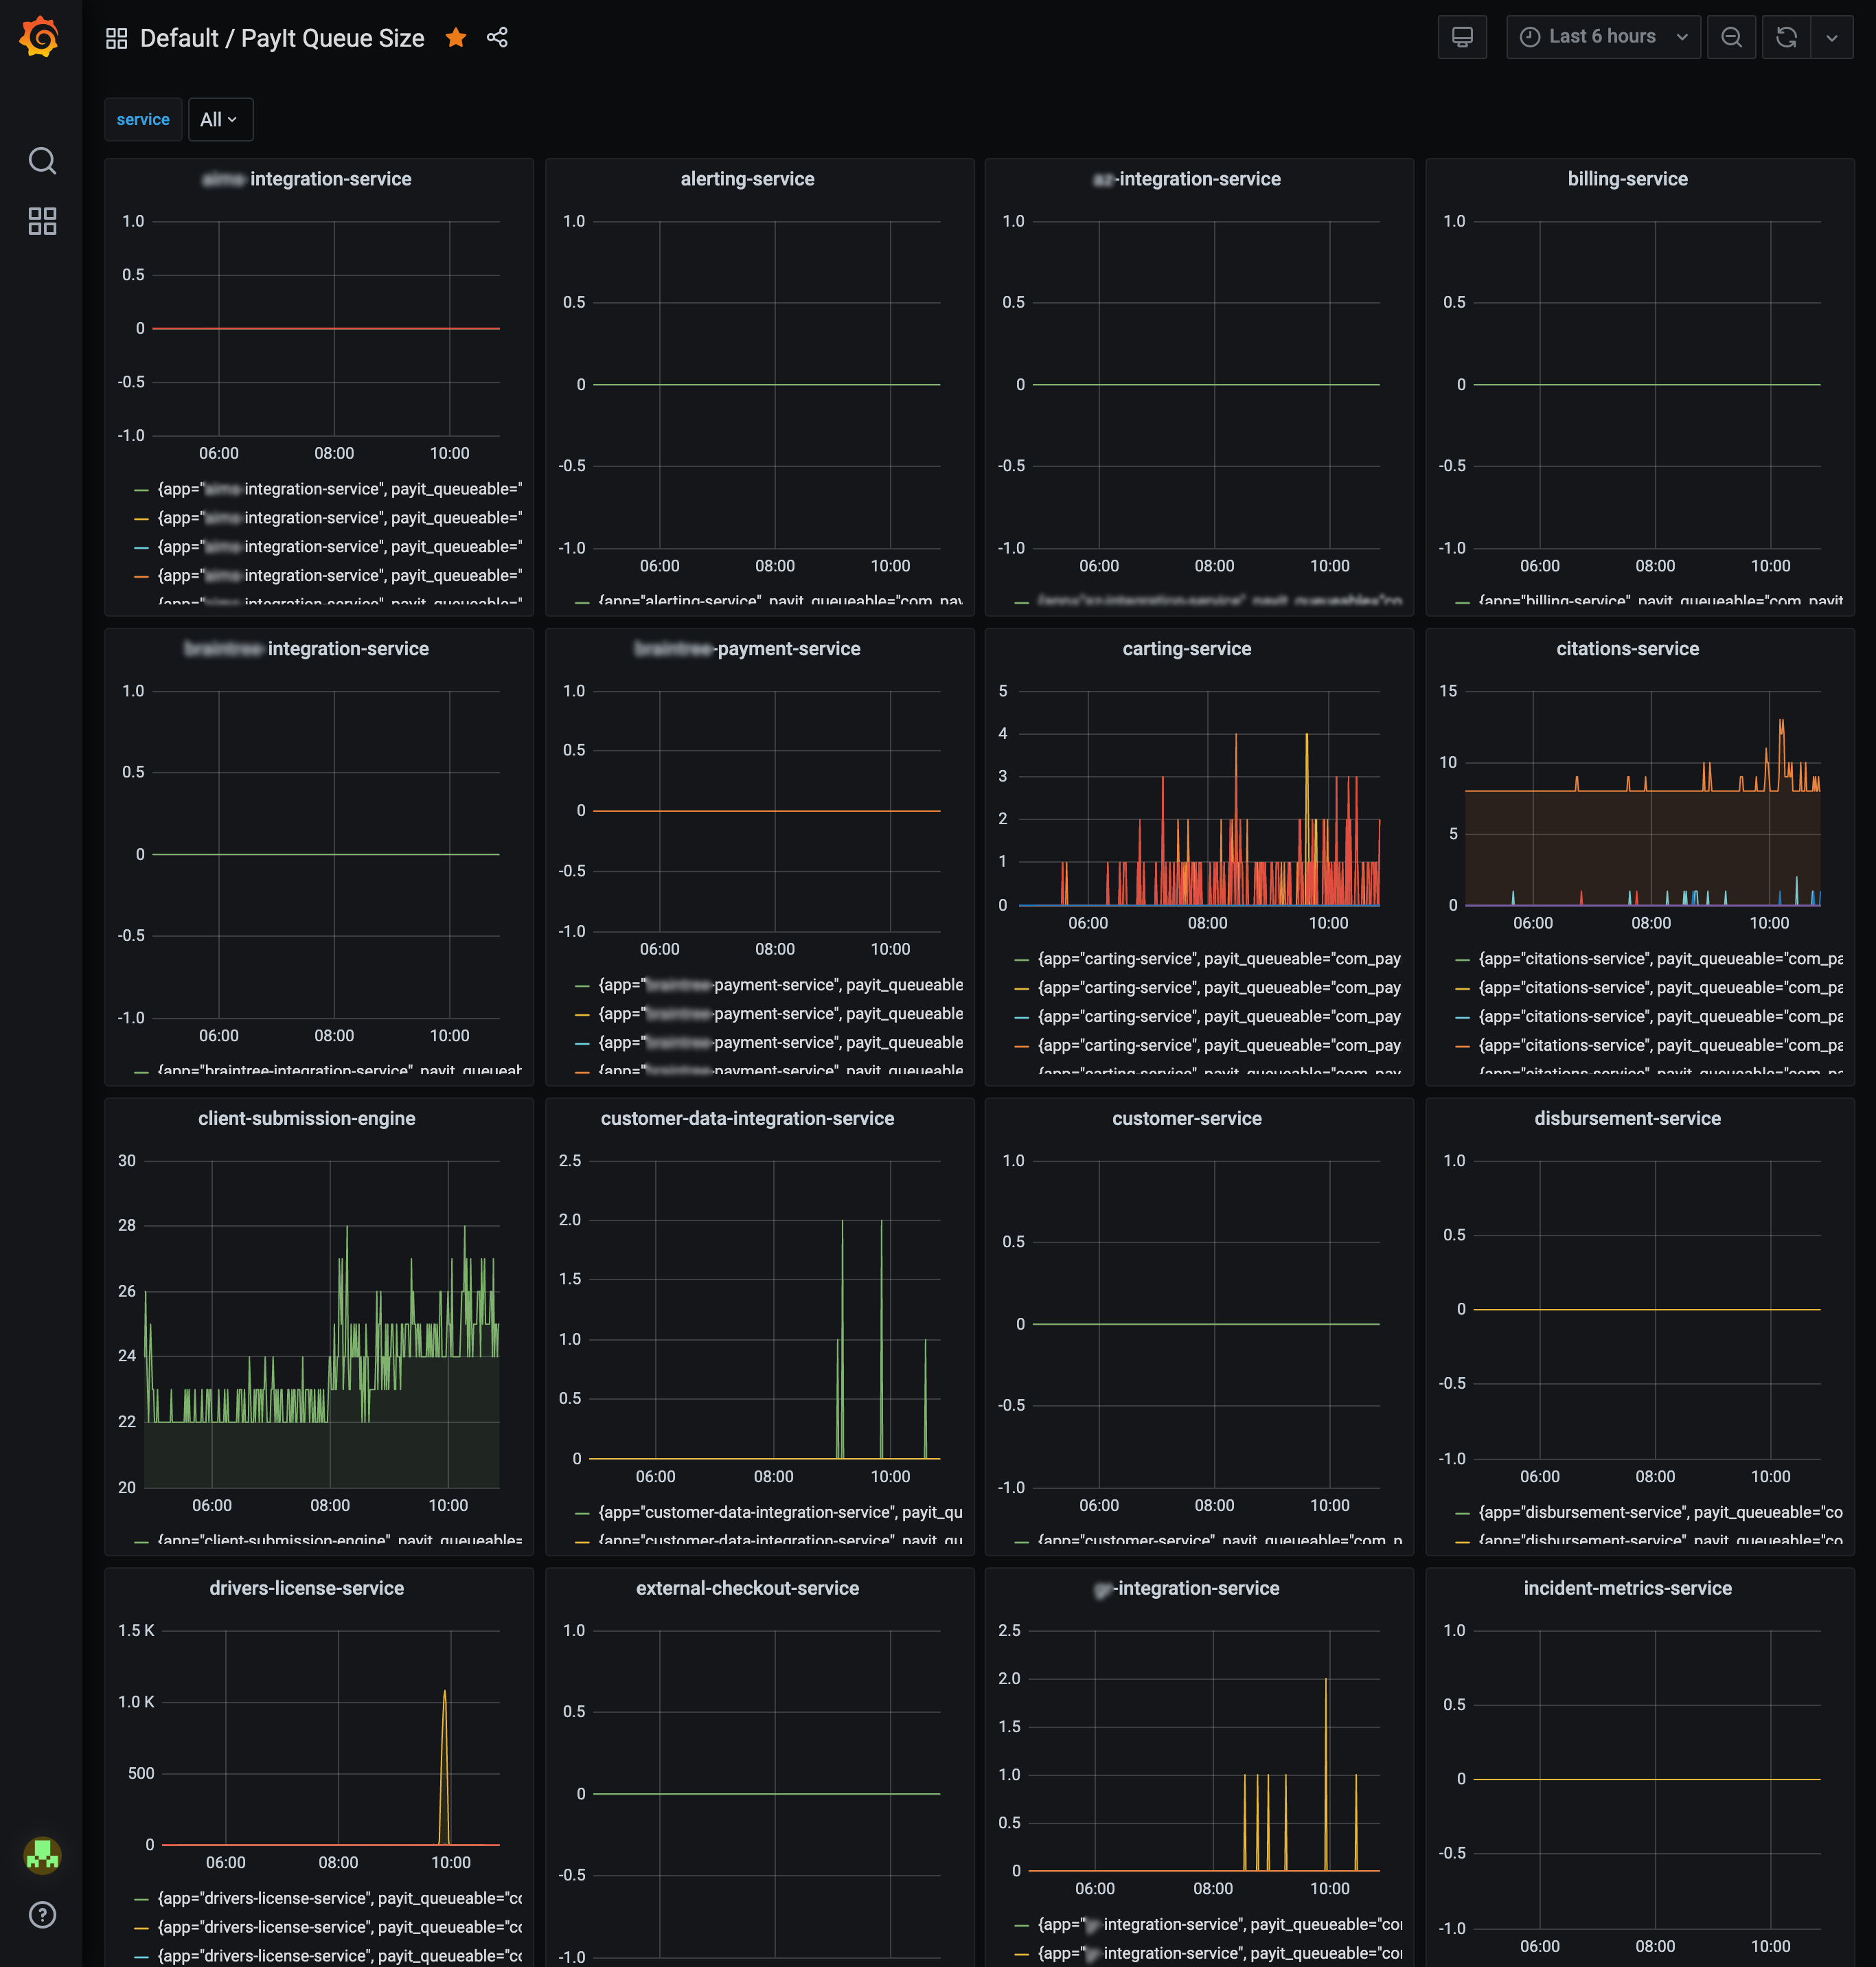
Menzenski says that realizing they could visualize their existing data and make it more intelligible to non-engineers “was a real ‘aha’ moment.” Compared to the days when they had to rely on that untrustworthy, noisy Slack alerting system that they had patched together from scratch, they now have a clear, standardized, and systematized way to visualize what’s in a healthy state, see it right in front of them, and take proactive action to fix it.
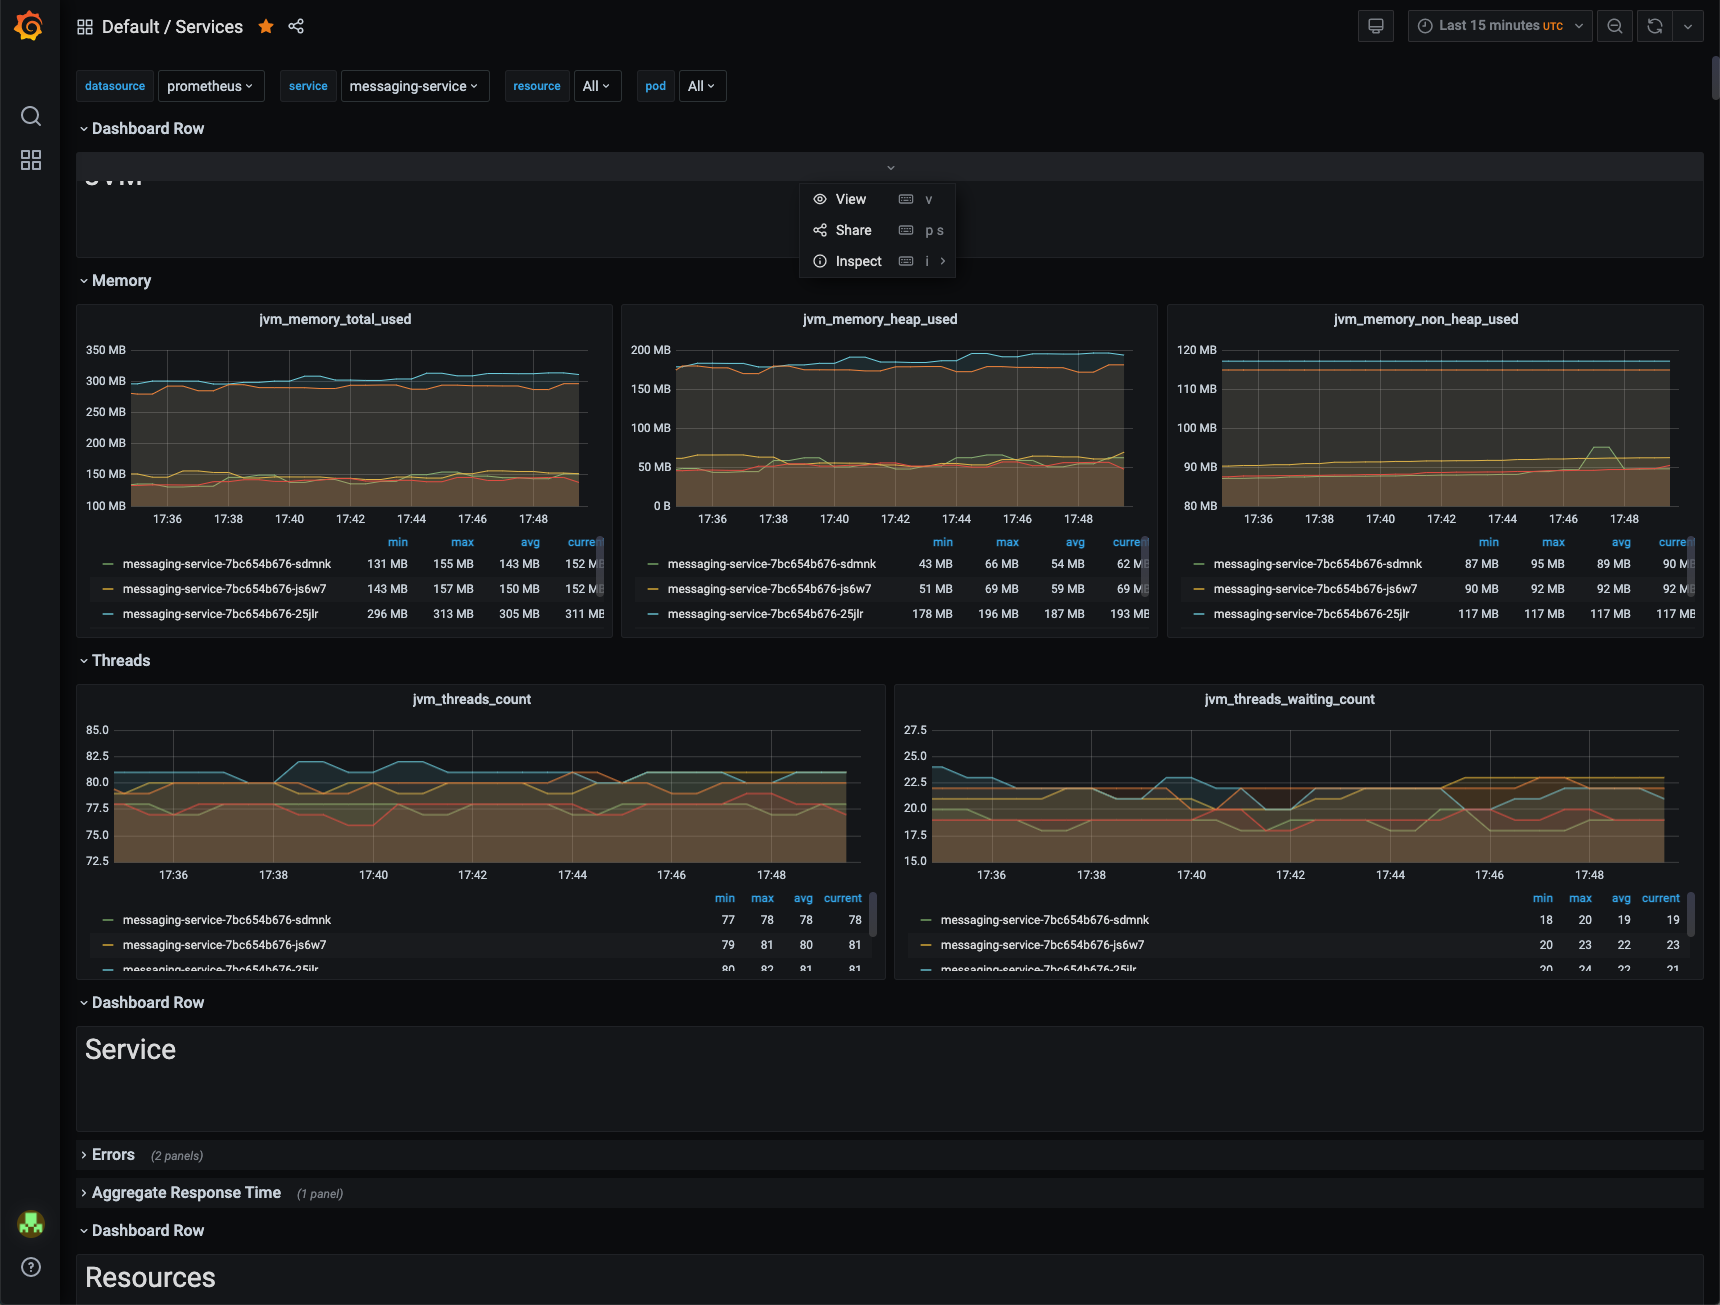
Grafana also helps PayIt improve the customer experience. One of its dashboards includes queues from PayIt’s messaging service, which sends emails to users to remind them of upcoming bills or confirm their related payments. Thanks to alerting, the PayIt team has been able to catch issues before the service begins sending duplicate emails that might confuse (and annoy) customers. And in the business of governmental service, ensuring this clear and consistent communication with the public boosts much-needed public confidence.
“It makes me glad we’ve got this data now,” Menzenski says.
Now that there is a centralized observability solution, when Payit recognizes an issue in one service, they can use that information to make changes in other services in order to avoid running into similar issues in the future.
Rich rewards
With Grafana, PayIt can do more than just catch and prevent these customer-facing issues — they can deflect them, too.
At the company, anyone with a PayIt email is authenticated to view the dashboards. As a result, non-engineers, including the support team, have access to data, so during a support issue there’s no longer a need to wait on the maintenance team — a potential customer experience bottleneck.
One instance when this comes in handy is when customers make a payment but don’t immediately receive their receipt, so they call customer support. A representative can look at a dashboard, see a backlog, and let them know their receipt will be coming soon. With their previous, manual observability solution, that would have been impossible for the support team to handle. The maintenance team would be inundated with these requests and pulled away from innovating new tools and systems for the company.
That ability to manage who gets data — and when — has paid off for the infrastructure team as well. Beers says that if someone reports an issue in an environment, the infra team’s first step is to redirect them to Grafana or one of the logging providers to try to gather as much data as they can before engaging a larger group.
Another benefit of being able to collect and visualize data across multiple environments with Grafana is that they can go back and look for trends after an event. “It’s really cool to be able to compare and contrast those kinds of metrics,” Beers says.
Grafana helps PayIt maintain the customer-centric engineering culture it needs to keep growing the business, but it’s also having an impact on engineering professional development, he notes. “Instead of having engineers out on their own slogging through log files, we can provide them a framework that’s a little bit more industry standard, and help them understand how you debug applications and complex systems.”
Adopting Grafana gave them an opportunity to empower newly created teams, too. When PayIt set up a new non-engineering team called client operations (made up of two client success team members), the team was given access to Grafana dashboards for interfacing with clients on day-to-day operational issues. This allows the engineers to stay focused on what truly requires their expertise. Now, if that file delivery issue pops up again, for example, the client success team can go to the client directly with the timestamp and let them know what’s missing—and even explain what went wrong.
“Having the data at our fingertips takes that conversation to a whole different place,” Menzenski adds.
Cache and checks
In general, Grafana has helped PayIt’s teams better locate and understand problems and their scope because they can see everything in one place.
It’s also made them appreciate the importance of certain services by seeing the impact they have on others. One particular area where they’ve had challenges is with caching. “We can go look at the percentile of response times to see what’s the ripple impact in the system,” Beers says. “That level of observability has really highlighted how critical those particular services are because of the number of consumers of them. If they have a problem, then the overall platform begins to have a problem.”
Once, they discovered that an issue with calls from their web app was similar to an issue with calls from the payment service. After several people did a deep dive into the dashboards, they were able to spot multiple spikes and bottlenecks and realized the problems were connected and affecting everybody. Thanks to their centralized observability platform, it took one hour on a phone call to find the problem rather than the several hours, multiple war rooms, and way too many people it would have taken had they been trying to correlate disparate datasets without Grafana.
Menzenski says the visualization that a Grafana dashboard delivers is indispensable. Without it, they might miss valuable information.
It’s sort of like all signal, no noise. You call Grafana up and it just shows you what you want, which is really nice.
Matt Menzenski, Software Engineering Manager
Looking to the future
Now that they know what Grafana can do for them, PayIt is considering broader ways to use it.
Going forward, Menzenski wants to work more with the non-engineering stakeholders. His goal would be to discover what data points — and what metrics they’re not yet collecting — could be valuable for them to have on a dashboard. “There’s so much potential,” he says. One thought is to create a dashboard that shows payment success versus failure. “If a particular service is seeing a spike in errors, that could be really valuable for our client integrations team.”
PayIt is also targeting a new no-code version of its platform, where the team can stand up a new integration without an engineer writing a line of code. “Can we make some dashboards so you can self-serve without involving engineering to go live?” Menzenski wonders. “There’s a lot of potential that we’re really just starting to think about. I personally feel like I’ve only really just scratched the surface of what I can do with this tool.”