How Lightbend monitors Akka Serverless platform-as-a-service infrastructure on Grafana Cloud
When top companies such as Capital One, PayPal, and Verizon have needed platforms for their demanding, globally distributed, cloud native application environments and streaming data pipelines, they’ve turned to Akka, the most popular implementation of the Actor Model for cloud native applications running on Kubernetes.
The company behind Akka is Lightbend, a leader in the world of cloud native applications and architectures. For more than a decade, Lightbend has been providing scalable, high-performance microservices frameworks and streaming engines for building data-centric systems that are optimized to run on cloud native infrastructure.
In June 2021, Lightbend announced the Open Beta of Akka Serverless (General Availability, November 2021), a new class of cloud native development platform-as-a-service. Observability is critical not only to the success of Akka Serverless but also Lightbend itself. After all, says the company’s Lead Site Reliability Engineer, Fernando Costa, “If you’re serving or hosting a company’s data and you have an incident, you can lose the customer.” And for that reason, the company relies on Grafana Cloud to monitor its Kubernetes clusters.
Because of the tools we have, we haven’t had any downtime with Akka Serverless yet.
Fernando Costa, Lead Site Reliability Engineer, Lightbend
With Akka Serverless, Lightbend co-locates “state” and functions, meaning that the data a function needs is delivered to the function when that data is needed. With this unique approach, Akka Serverless brings developers an API-first, database-less programming model and serverless runtime. “We wouldn’t be able to operate Akka Serverless without observability. It’s everything,” Costa says. “We run those functions without knowing what they do or anything about their logic, but we need to keep them running and have a good way to collect their metrics. Observability gives us better understanding from the outside, since we can’t check the function.”
With automation, Lightbend also can stay on top of all of their customers’ functions simultaneously without having someone checking on them at every moment, Costa explains. “We have customers using the system now, and they can go from two pods to 100 pods in seconds.” But Lightbend might not know that if it weren’t for Grafana Cloud. “Without a tool like this, we couldn’t do much to detect and alert on any possible anomaly or failure,” he says. “You can’t watch everyone at the same time.”
Monitoring with Grafana helps Lightbend have quicker response times to meet SLAs and SLOs. “We can look and see if Akka Serverless is working — and prove it’s working and that our servers were responding in a timely manner,” he explains.
Observability helps Lightbend stay on top — and ahead — of their customers’ experiences. “You don’t want to have an incident and not know about it — or worse, have the customer tell you about it,” Costa says. “The value of monitoring is knowing that something is wrong even before your customer notices, or in some cases, before anything happens.”
Starting from scratch
Costa joined Lightbend in 2020, and up until that time, Akka Serverless didn’t have a centralized observability tool. He was familiar with Grafana from a previous job as a system administrator, and had been using it for about four years.
Back when he had tried Grafana for the first time, Costa was impressed by how easy it was to use out of the box. “It was nice to just start graphing things,” he says. And in terms of observability, he adds, “It was the perfect tool to predict or prevent issues.”
Flash forward to when Costa started thinking about how to address Lightbend’s needs. He quickly realized that Grafana was a perfect match, not the least because his colleagues were open source fans. “Also, all the libraries we write can expose metrics using Prometheus easily,” he says. “It was a win-win situation.” Costa also likes the flexibility Grafana provides. “Even better, I can use the same tool for multiple data sources.”
Before ultimately choosing Grafana, Costa tested another competitive solution for comparison. He thought it was fine for basic monitoring of metrics and events, but not Lightbend’s advanced needs. Those include being able to manipulate data and ensure its users deployments are operating properly, all while maintaining the strict IaaC standards of the project. “If you need to publish metrics yourself,” he says, “Grafana is a better fit.”
Once Costa had committed to Grafana as his stack of choice, he was then faced with another decision: how best to host, manage, and deploy it in a way that optimizes both his team’s workload and Grafana’s ability to scale with the needs of Lightbend’s business.
We need to focus on our product, not something else. And Grafana Cloud gives us the peace of mind to do just that.
Fernando Costa, Lead Site Reliability Engineer, Lightbend
Even though Costa had previous experience with self-hosting Cortex and had the scripts that would have made it possible for Lightbend to do that as well, there were too many downsides to that type of setup. “It would be like an FTE’s job just to maintain, and there were security implications,” Costa explains. “It would require at least another cluster, and we’d have to send data somewhere else and make sure it’s properly stored. I also thought we’d have Cortex and Thanos on the side, so it was a lot to handle.”
Costa also showed his manager how much it would cost to cover all of that compared to the cost of Grafana Cloud. For all of those reasons, the decision to sign up for Grafana Cloud — and leave concerns about scalability, availability, backup, and more to Grafana Labs — was an easy one. “Everyone is happy,” he says. “Grafana will be literally the easiest renewal for us.”
Thanks to Grafana Cloud, Costa is able to focus on Akka Serverless’s performance rather than running an observability infrastructure stack. “We need to focus on our product, not something else,” he says. “And Grafana Cloud gives us the peace of mind to do just that.”
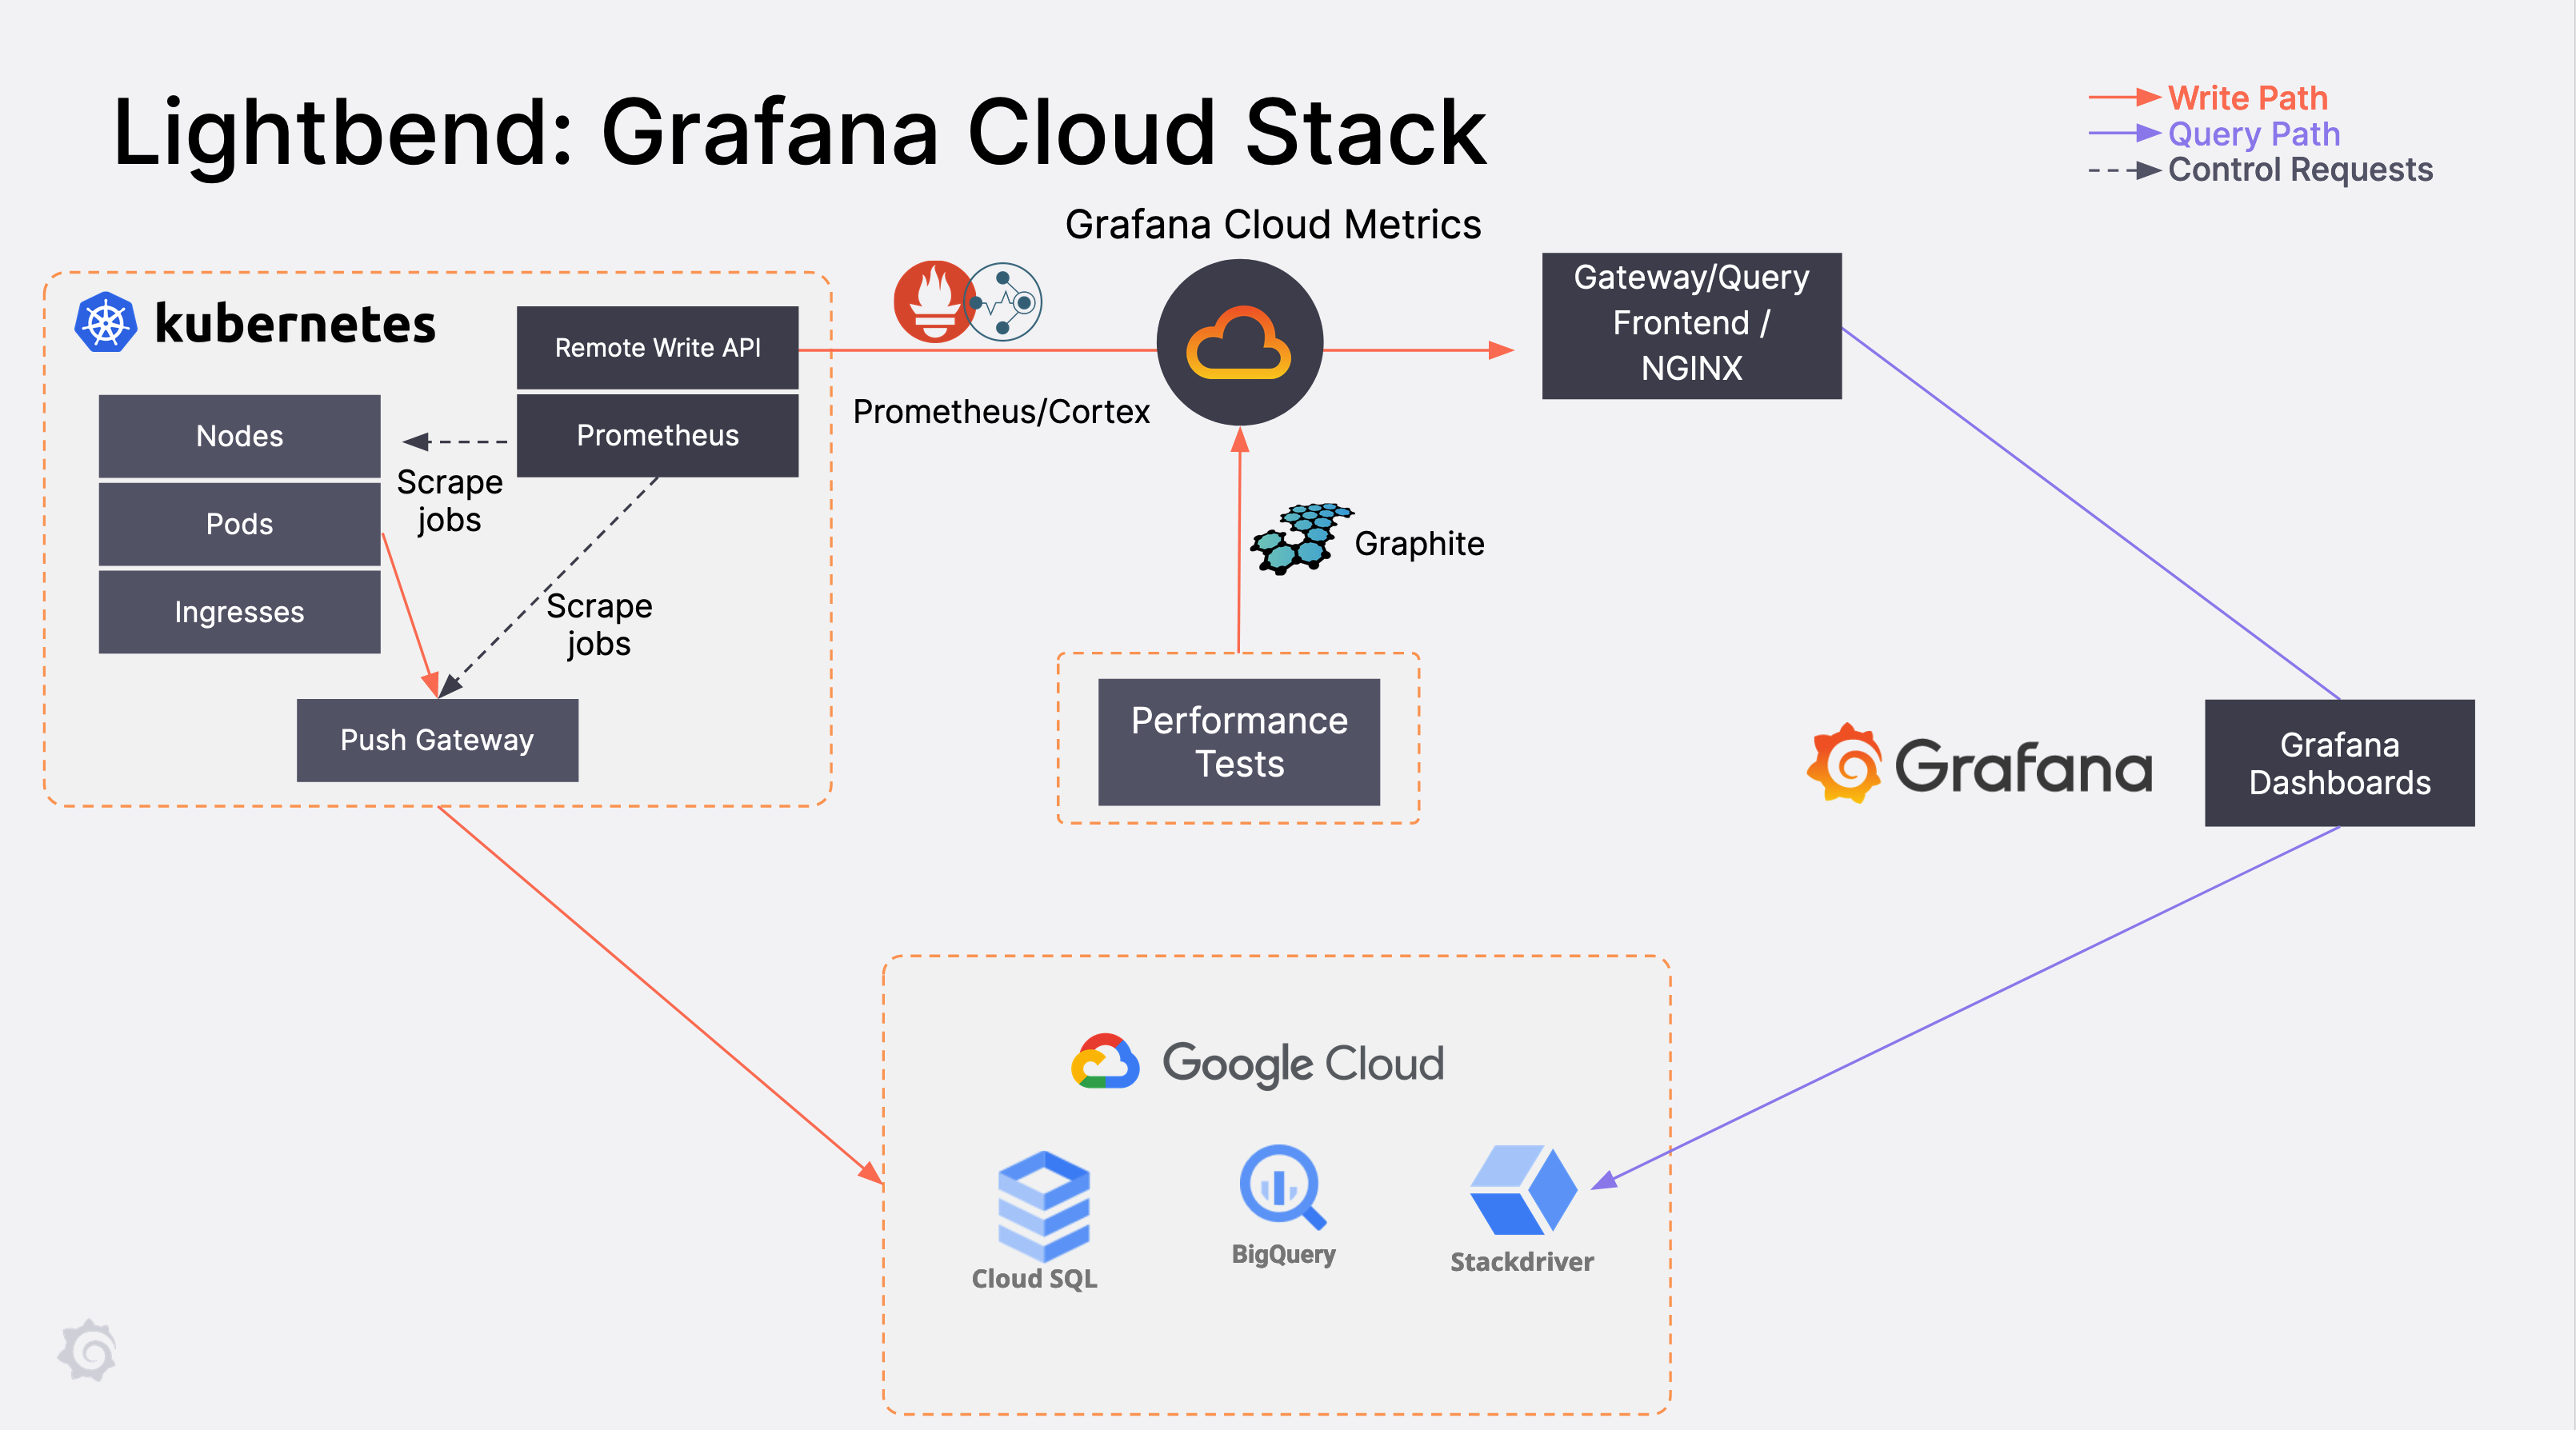
Data flow design
After deciding on the tool and deployment method that would work best for Lightbend, Costa set out to make sure it was all architected correctly.
Lightbend manages and orchestrates containers in Kubernetes and has Prometheus running on the same cluster. They have two Kubernetes clusters in production with 54 nodes and 343 customers (and growing). In Grafana Cloud Metrics, the company has over 420,000 active series for Prometheus and Graphite.
Lightbend pulls data mainly from Prometheus, but also from Google Stackdriver. “Instead of just pulling data and exporting it to Prometheus, I’m just reading straight from Google,” Costa says. The company currently has Postgres and Graphite data sources as well, and they rely on Grafana Cloud Metrics for both Prometheus and Graphite.
Costa created Lightbend’s first Grafana dashboards, and he’s building types such as Node Exporter, API server, Kubernetes API, and Istio. But the tool became so popular that now users — who aren’t even on his team — are creating dashboards of their own in order to solve problems Costa’s team hadn’t even thought about when first setting up the Grafana system. There are more than 25 members in the portal. “We have a lot of different people creating dashboards,” he says. “Some are even running BI.”
If any team at the company is running Kubernetes and wants to add metrics to analyze in Grafana, they only need to tag the pods and deployments properly. “There are new things every day,” Costa says. “This would be impossible to do using other tools — or it would require us to write code and change our code in order to do it. Neither of those is worth it given what Grafana Cloud Metrics allows us to do out of the box.”
Costa sends around a daily Grafana-generated report, and he says Lightbend CEO Jonas Bonér has even taken notice of the data in the graphs. “One time he asked why one number was 20 milliseconds one day and two seconds the next.” Costa was able to find the answer in less than two minutes after checking a more detailed dashboard.
The investment in Grafana has not only helped the company as a whole, but it’s changed the way Costa and his team function. “My team’s life without Grafana would be a nightmare,” he says. “Not everyone has access to Kubernetes and our other Production environments, so anyone that needed a metric would come to us to ask for it. I don’t have the commands to calculate or sum metrics ready in my mind, so it would take a lot of time to get their answers.” Instead, Costa and his team can focus on looking at trends and staying ahead of any potential concerns.
Key dashboards
Costa and his team are constantly working within Grafana to keep track of what’s happening on Akka, and a few of their dashboards are regular go-tos. Here’s a sampling of some of Lightbend’s key dashboards:
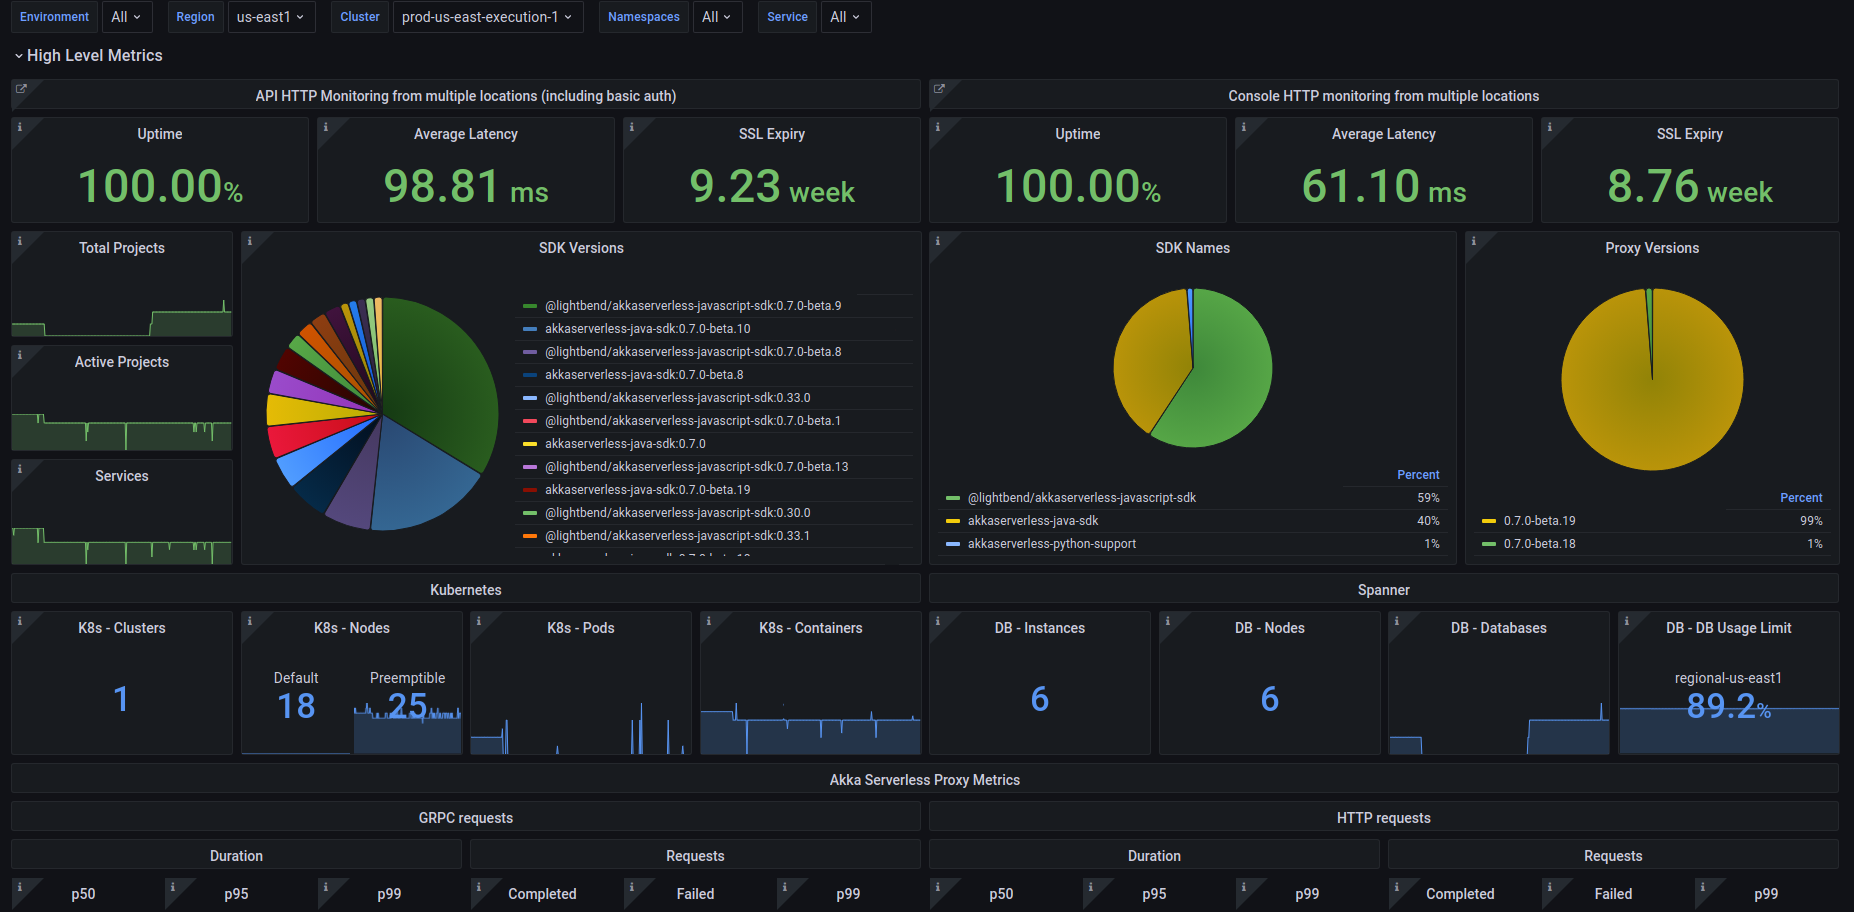
Akka Serverless general metrics
One of Costa’s favorite dashboards is used to monitor high-level metrics. Panels on the dashboard include total projects, active projects, services running on Akka Serverless, gRPC requests, commands, trends, alerts, and so much more. This is the data that is shared daily across the company. “It’s pretty much all of the numbers from the past 24 hours,” he explains, “and there’s no data that we cannot show.”
Costa recalls an incident when Grafana dashboards and alerting helped Lightbend head off what could have been a big challenge. A major Google outage affected several companies, but before Google had declared the incident, Costa said his team noticed that new nodes weren’t launching. “We were able to keep the systems up even with this major outage because we saw all the indicators that something was wrong and we started testing. They couldn’t launch nodes for two days, but because of the alerts triggered from our Grafana dashboard telling us there was going to be an issue, we had already launched extra nodes and were able to ride out Google’s issues without any knock on effect on our customers”
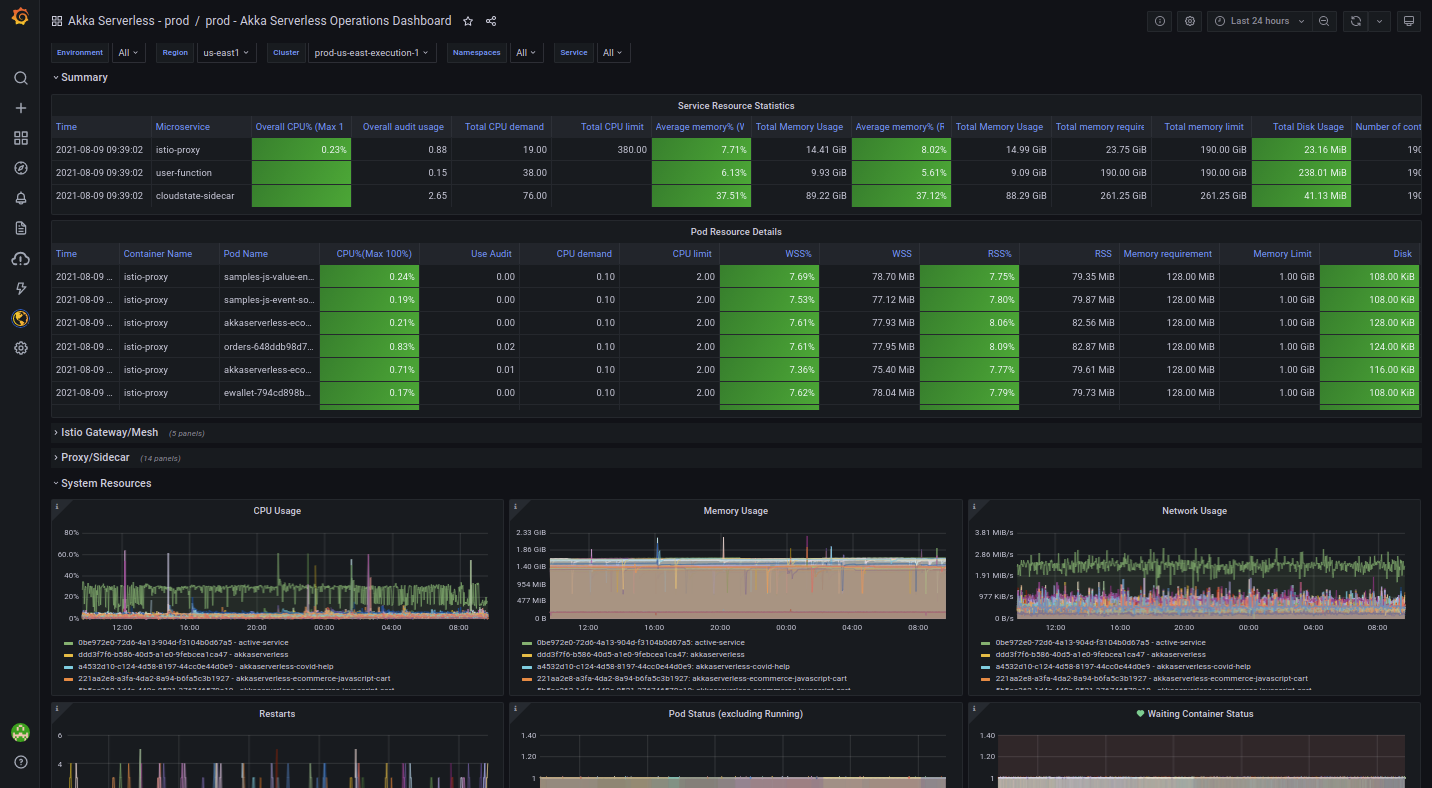
Operations
The dashboard below is used by Lightbend’s Akka Serverless and operations teams and it’s a real time-saver. “Basically, if I have any issue, I can come here and see what’s going on without having to access Kubernetes or log into the system,” Costa says. “We can see all production deployments, all the containers, everything that’s running. I can also select by namespace and see how the requests are running, or check data from a sidecar.”
By not having to gather all of the information manually, Costa estimates using the Grafana dashboard saves a support team member at least 20 to 30 minutes every time there’s an issue — and given that they can have two to three issues per week, that can add up over time and team members. “It’s very time- and cost-effective in the end,” he says.
It’s more than just a time- and money-saver, though. “It’s also security,” Costa says. “I can have access to production if I need it, but I don’t even need to access Kubernetes on a daily basis anymore. If I need to check something, I just come to this dashboard.”
Beyond Costa and his team, Lightbend’s technical support team also takes advantage of the secure single pane that Grafana affords them. “They have very minimal access to our production environments, so they use this dashboard on a daily basis to see what happened, or if a container wasn’t running a CPU — whatever the issue may be — as a way of supporting Akka Serverless developers.”
Synthetic monitoring
Lightbend also uses synthetic monitoring, a key feature of Grafana Cloud. The Akka Serverless metrics dashboard below includes times for some of the external endpoints, which Costa calculates with data from synthetics. He plans to do more. “We’re now designing how we will be using synthetics to monitor the response time and availability of each deployed service from different geographies — like a basic validation,” he explains. Lightbend will use that as a part of its SLO reporting.
This synthetic dashboard monitors Akka Serverless’ API availability. Its API is one of the key parts of the system since it’s the entrypoint for its customers to interact with the system and manage their services.

Open source and support
Non-open source observability tools don’t allow for full visibility into the software running, so one of the benefits of Grafana is that customers can find (or create) solutions to issues on their own. “I usually open GitHub and try to find something or write code myself to change something,” Costa says.
When Lightbend experienced a broken pipeline, he was able to reference the Grafana source code in GitHub and run a Docker container in test to quickly confirm the issue. Having that information handy expedited support with the Grafana team. “Their responses have been fast,” he says, “and I’ve gotten all the answers I’ve needed.”
Looking forward
Lightbend has introduced a performance test for Akka Serverless, and has been using Grafana as part of that. “We are running a performance on the older version, pushing the data to Grafana, applying the upgrade, running it again and comparing the two, and looking for an alert if they change drastically,” Costa says. “Alerting should come once we have enough data to decide the right thresholds.”
He’s hopeful that in the future, Lightbend can begin using Loki (and Grafana Cloud Logs) so he can seamlessly correlate metrics and logs. At this time, Lightbend’s logs are in Google Cloud Platform, so Costa has built dashboards with links that go back to Google Stackdriver, which selects the proper namespace. “But it’s not the same thing,” he says. “I’m a very visual person, so, if I can visualize things to correlate it helps me a lot instead of jumping through links.”
As he thinks about the way he relies on Grafana at Lightbend, Costa marvels at the way advances in technology have changed monitoring and observability over the years. “Ten years ago, I managed about 200 servers. They had names — they were like pets. And now it’s totally different. It’s like we have herds of cattle,” he says. “It’s amazing to see how with observability and automation, we can manage thousands of servers and thousands of applications. There are tools that help us a lot, and Grafana is one of them.”