From ELK to Grafana Loki: How eCommerce leader Blinkit modernized their logging stack with Grafana Cloud
Blinkit, formerly known as Grofers, is an instant grocery-and-essentials delivery company serving millions of consumers across India. Customers can use a mobile app to place their orders on the go, and Blinkit has 2,000-plus employees and warehouses across the country to ensure that all deliveries are made in 10 minutes or less.
As the company scaled and began offering instant deliveries to more and more locations and consumers across a broad swath of the country, Blinkit’s legacy logging tool was becoming too expensive and cumbersome to manage. Developers ended up spending a lot of their efforts on maintaining a self-managed Elastic Stack, leaving no room to focus on improving products and services for their customers.
“We were spending half of our time making sure everything was up and running with the ELK Stack and tuning our logs continuously so that we wouldn’t crash,” says Blinkit Engineering Manager Vaibhav Krishna.
Add to cart: Grafana Loki
In response, the company dropped Elastic and embraced a new logging solution — Grafana Loki. The delivery service was already leveraging open source software such as Grafana for its dashboarding and Prometheus, which streams about 1.5 million metrics per month in a Kubernetes environment on AWS. With the addition of Grafana Loki to their stack, Blinkit now feeds all its application logs into their Loki instance, which can total up to 60TB of log data every month.
“Grafana Loki, our new log aggregation system, stores and allows us to query logs from all applications and throughout the infrastructure,” says Krishna. “It fits very well into our ecosystem.”
Though the team started with a self-hosted Loki instance, they quickly realized they didn’t want to repeat previous mistakes and spend resources on maintaining a product versus innovating new ones. So — in addition to using InfluxDB and AWS CloudWatch for legacy systems — they quickly migrated over to the hosted Grafana Cloud Logs service, which now allows Blinkit to seamlessly integrate their metrics and logs in one place and use the comprehensive data in new, impactful ways.
“Between Loki and Grafana you can get your logs and metrics from your logs in one place,” says Krishna. “In certain use cases, Loki is the key monitoring tool, and we have started relying on Loki as one of our main metric sources as much as we do Prometheus.”
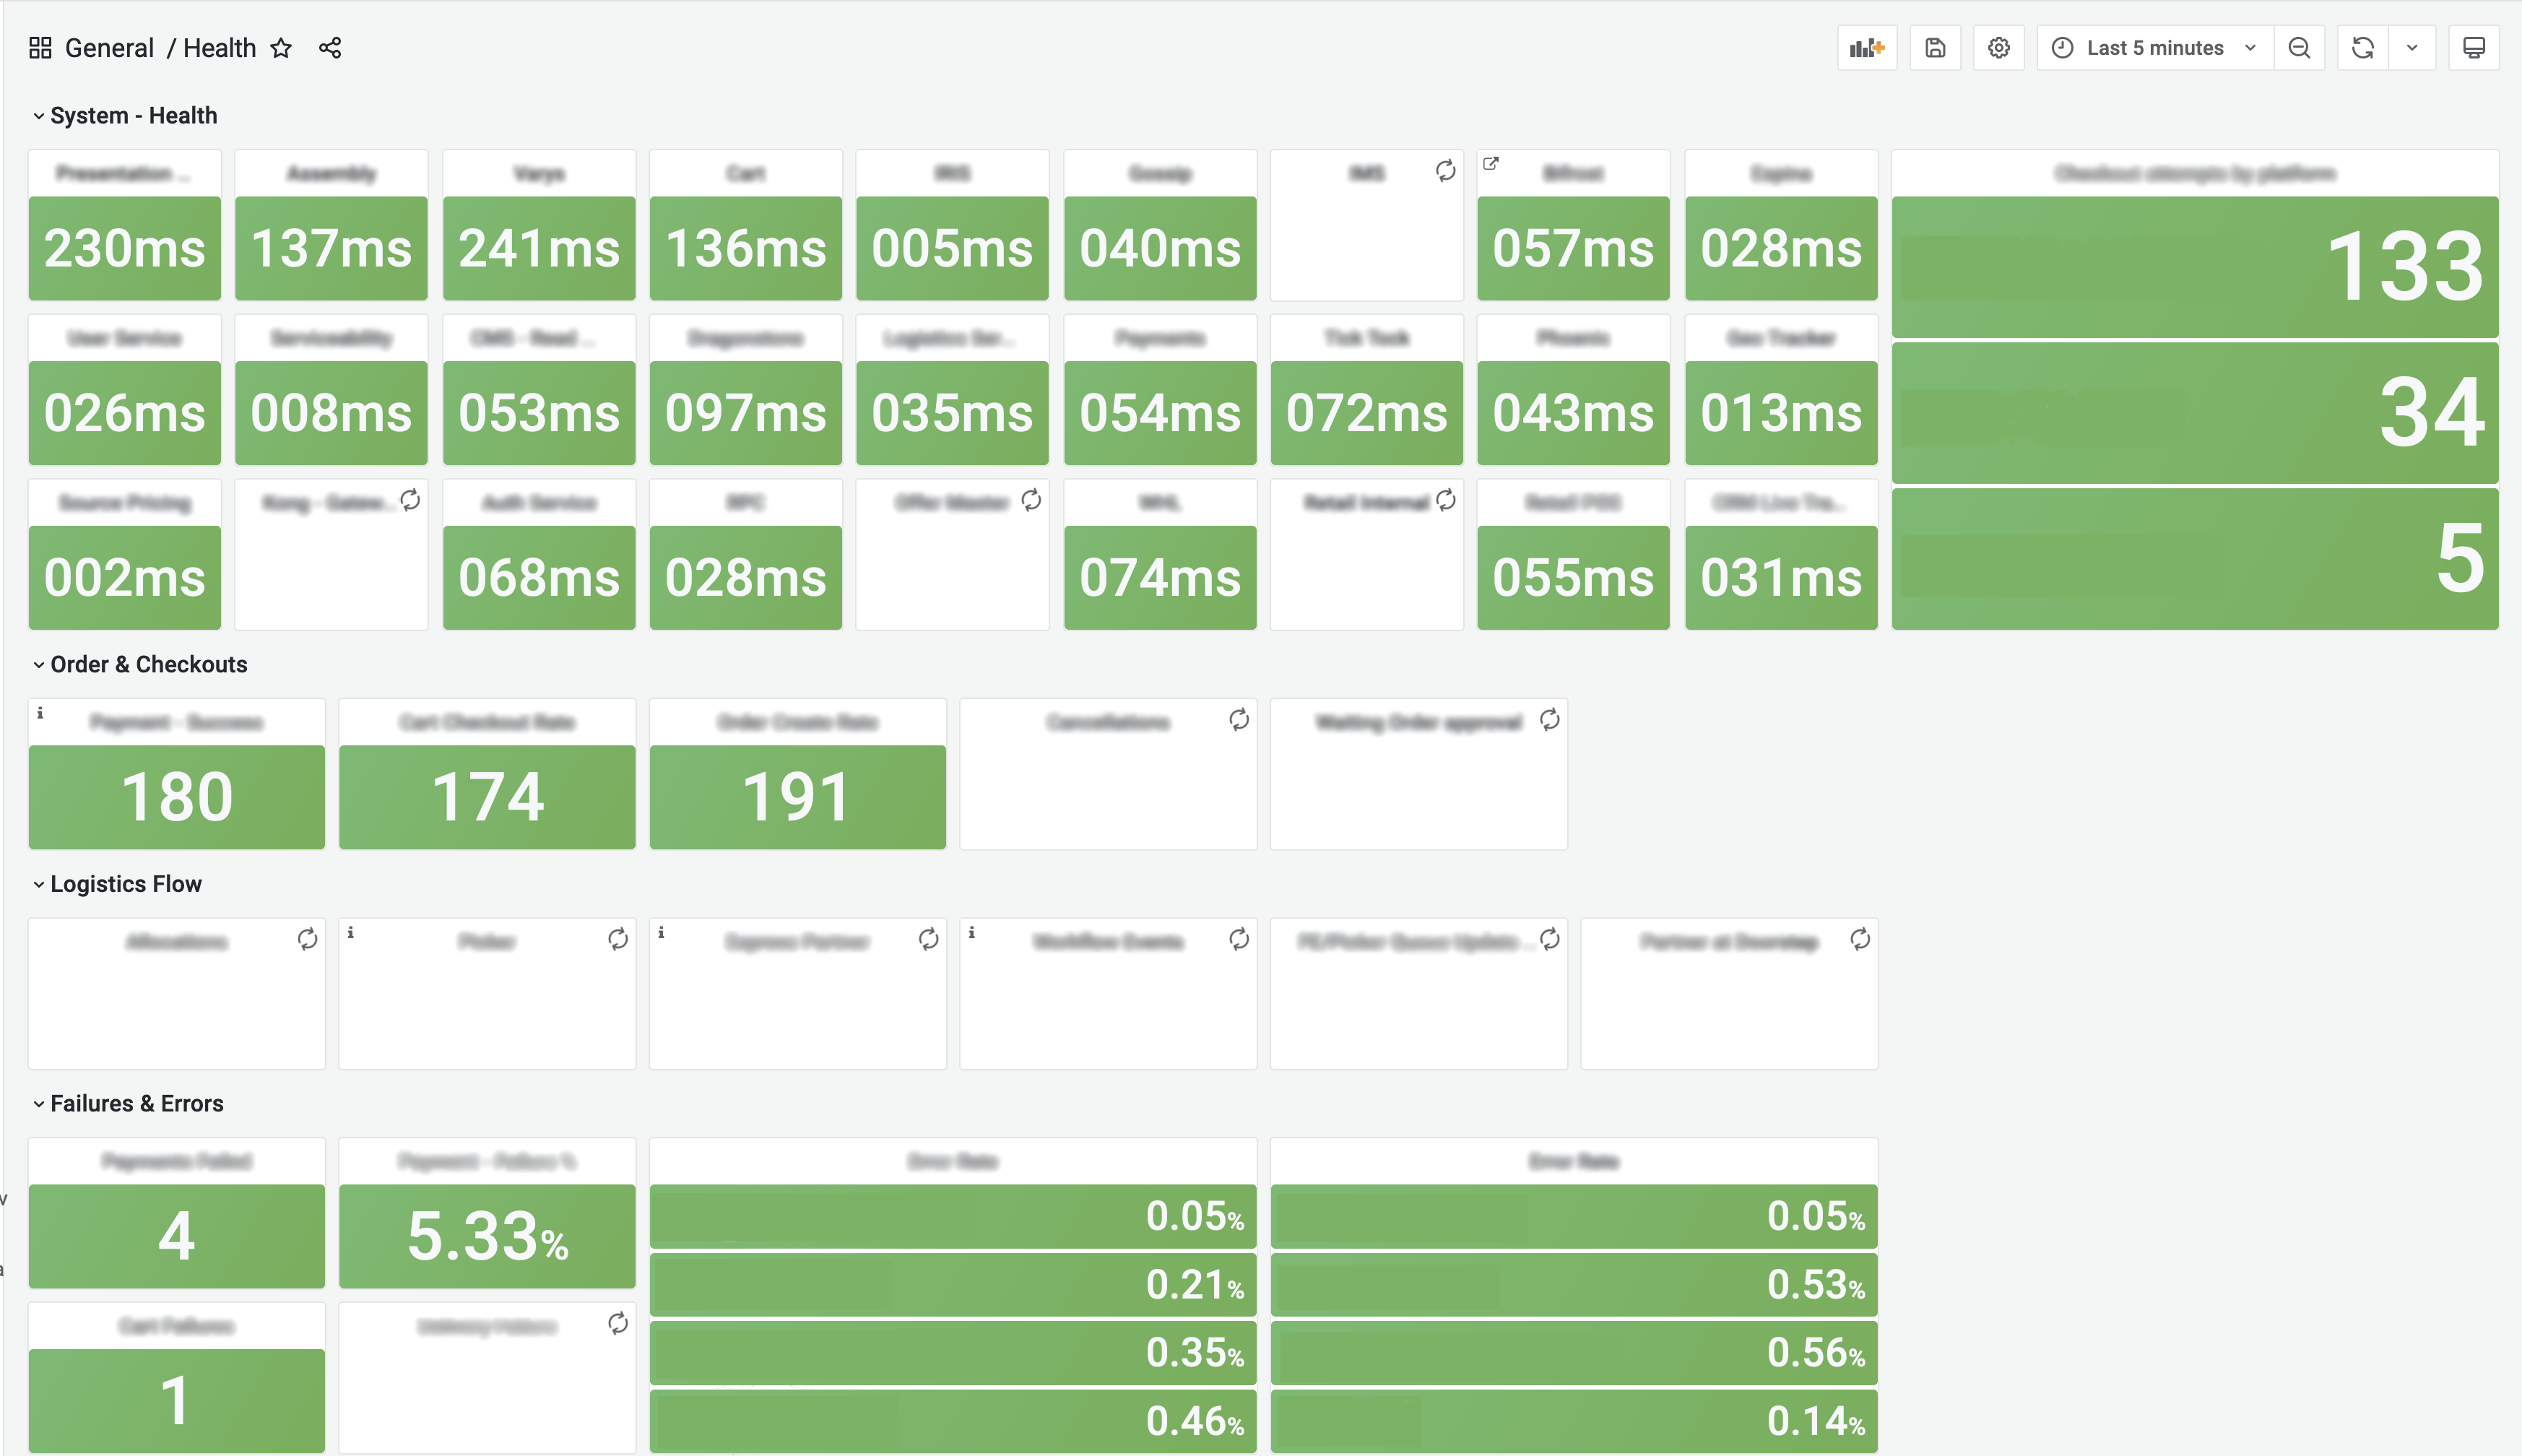
Above, Blinkit’s internal Grafana homepage with customized stat panels showcasing key production and application data.
Overall, Blinkit monitors both application and infrastructure data sources with its Grafana Stack. One key data source visualized in Grafana is the customer checkouts per minute as it has a direct connection to their customer satisfaction and loyalty metrics. Now that they’ve moved from the ELK Stack to Grafana Cloud, the Blinkit team is no longer missing out on crucial data needed to see the whole observability picture in real time. The Blinkit team can fix issues quickly before consumers succumb to hiccups in the online checkout process, reducing their desire to abandon their carts and the associated revenue that would be lost because of it.
Grafana helps us make sure that our checkout is always functioning for our customers. If we don’t have a working checkout system, we don’t have an e-commerce platform.
Vaibhav Krishna, Engineering Manager, Blinkit
“You build it, you maintain it”
More than 200 Blinkit engineers utilize Grafana in some form or another for visualizations under a “you build it, you maintain it” philosophy.
For each new product that Blinkit engineers develop, they also build their own Grafana dashboards to monitor its performance, leaning on out-of-the-box panels as well as those that are readily available on Grafana’s community dashboard directory.
“Every time we get a new tool, we use a Grafana panel from out in the community to monitor it,” Krishna says.
And if there was ever a question among the team, Grafana Labs was there to step in. Aside from monthly meetings with technical account managers, Blinkit also benefited from monthly engineering sessions where they had direct access to the maintainers of Loki as part of their enterprise-level support services. “We could go to them with some very basic queries, and we would get responses,” says Krishna, who also said the Loki team helped build some of their early Grafana dashboards. “We also got previews of what was coming up, and they were actively seeking feedback.”
Blinkit engineers have also learned a lot from the Grafana open source community at large, which is always willing to help with simple to complex questions.
“We are very motivated by the open source component of Grafana,” Krishna says. “We love engaging with the community. It’s easy to tell that Grafana puts in a lot of effort to build and maintain a vibrant community. I think that’s cool.”
They also believe in contributing back. Blinkit’s open source tool, Legend, helps build and manage Grafana dashboards with pre-filled metrics and alerts. Legend allows Blinkit engineers to set up Grafana dashboards automatically without manually having to write CloudWatch, Prometheus, or InfluxDB queries. Best of all, Legend employs the USE and RED methodologies for monitoring service and infrastructure-level metrics. (For more on the tool, check out Krishna’s recent ObservabilityCON talk on demand)
“We want to move in the direction towards creating automated dashboards,” says Krishna.
Blinkit’s future with Grafana
As Blinkit’s $1 billion-dollar business continues to scale, Krishna hopes his team’s dashboarding skills will evolve to reflect the increasing volume and complexity of their data sources and systems.
With all the visualization options available, “I’d like to improve our panels from line graphs and bar charts to heat maps and other panels to get a better visualization of some of the metrics we’re looking at,” says Krishna. “We haven’t done a large-scale adoption of all of the different options yet.”
He is also looking to add to the Grafana Stack with distributed tracing and Grafana Tempo on the horizon as well as investigating alerting and monitoring SLAs and SLOs with Grafana.
Blinkit is excited about the future of Grafana Cloud, which we will continue to embrace as we scale to remain India’s leading instant-delivery platform.
Vaibhav Krishna, Engineering Manager, Blinkit.
So no matter where their customers live, Krishna is confident that Blinkit will always deliver on their quick-service promise. Says Krishna: “We’re able to move faster because of Grafana.”
Grafana Cloud is the easiest way to get started with metrics, logs, traces and dashboards. We have a generous free forever tier and plans for every use case. Sign up for free now!